Data & Analytics > Log & Crash Search > Console User Guide
Log & Crash Search can be applied in the following order:
- Enable Service Create a project on the console and enable Log & Crash Search.
- Send Logs
Start sending logs via Log & Crash Search SDK. - Check Logs
Go to Log Search or App Crash Search to find logs in many ways, like a chart or search function.
Select a Project
Access console and select an organization and project from menu on the left. When there is no organization or project available, create one. - Select ORGANIZATION > PROJECT from the menu on the left.
See the NHN Cloud Console Guide for how to create an organization and a project.
Enable the Service
While a project is selected, click Service on top of the screen and go to Log & Crash Search under Data & Analytics and enable it. When a service is enabled, (v) is displayed by the service name.
[Note]
You can send logs in about five minutes after service is enabled.
When Log & Crash Search is enabled, Data & Analytics > Log & Crash Search shows on the menu, with the Appkey created.
Check Appkey
To send logs, it is required to check Appkey.
- Click Data & Analytics > Log & Crash Search > Log Search on the left navigation menu.
- Click URL & Appkey on top of the screen and check Appkey.
Send Logs
To send a log, Log & Crash Search SDK is required. You can download an SDK from Data & Analytics > Log & Crash Search of NHN Cloud Downloads
[Note]
When using the SDK, session logs sent along with crash logs are not exposed on the search screen. When sending session logs, the count is added to and reflected in the number of daily log capacity of Resource Provision Policy in the same way as other logs. However, it is not reflected in the API call charges.
Search Logs
Logs can be searched by using Log Search.
- Click Data & Analytics > Log & Crash Search > Log Search.
- Log Search provides around-the-clock log-volume graphs with details.
Details of the Log Search screen are as below.
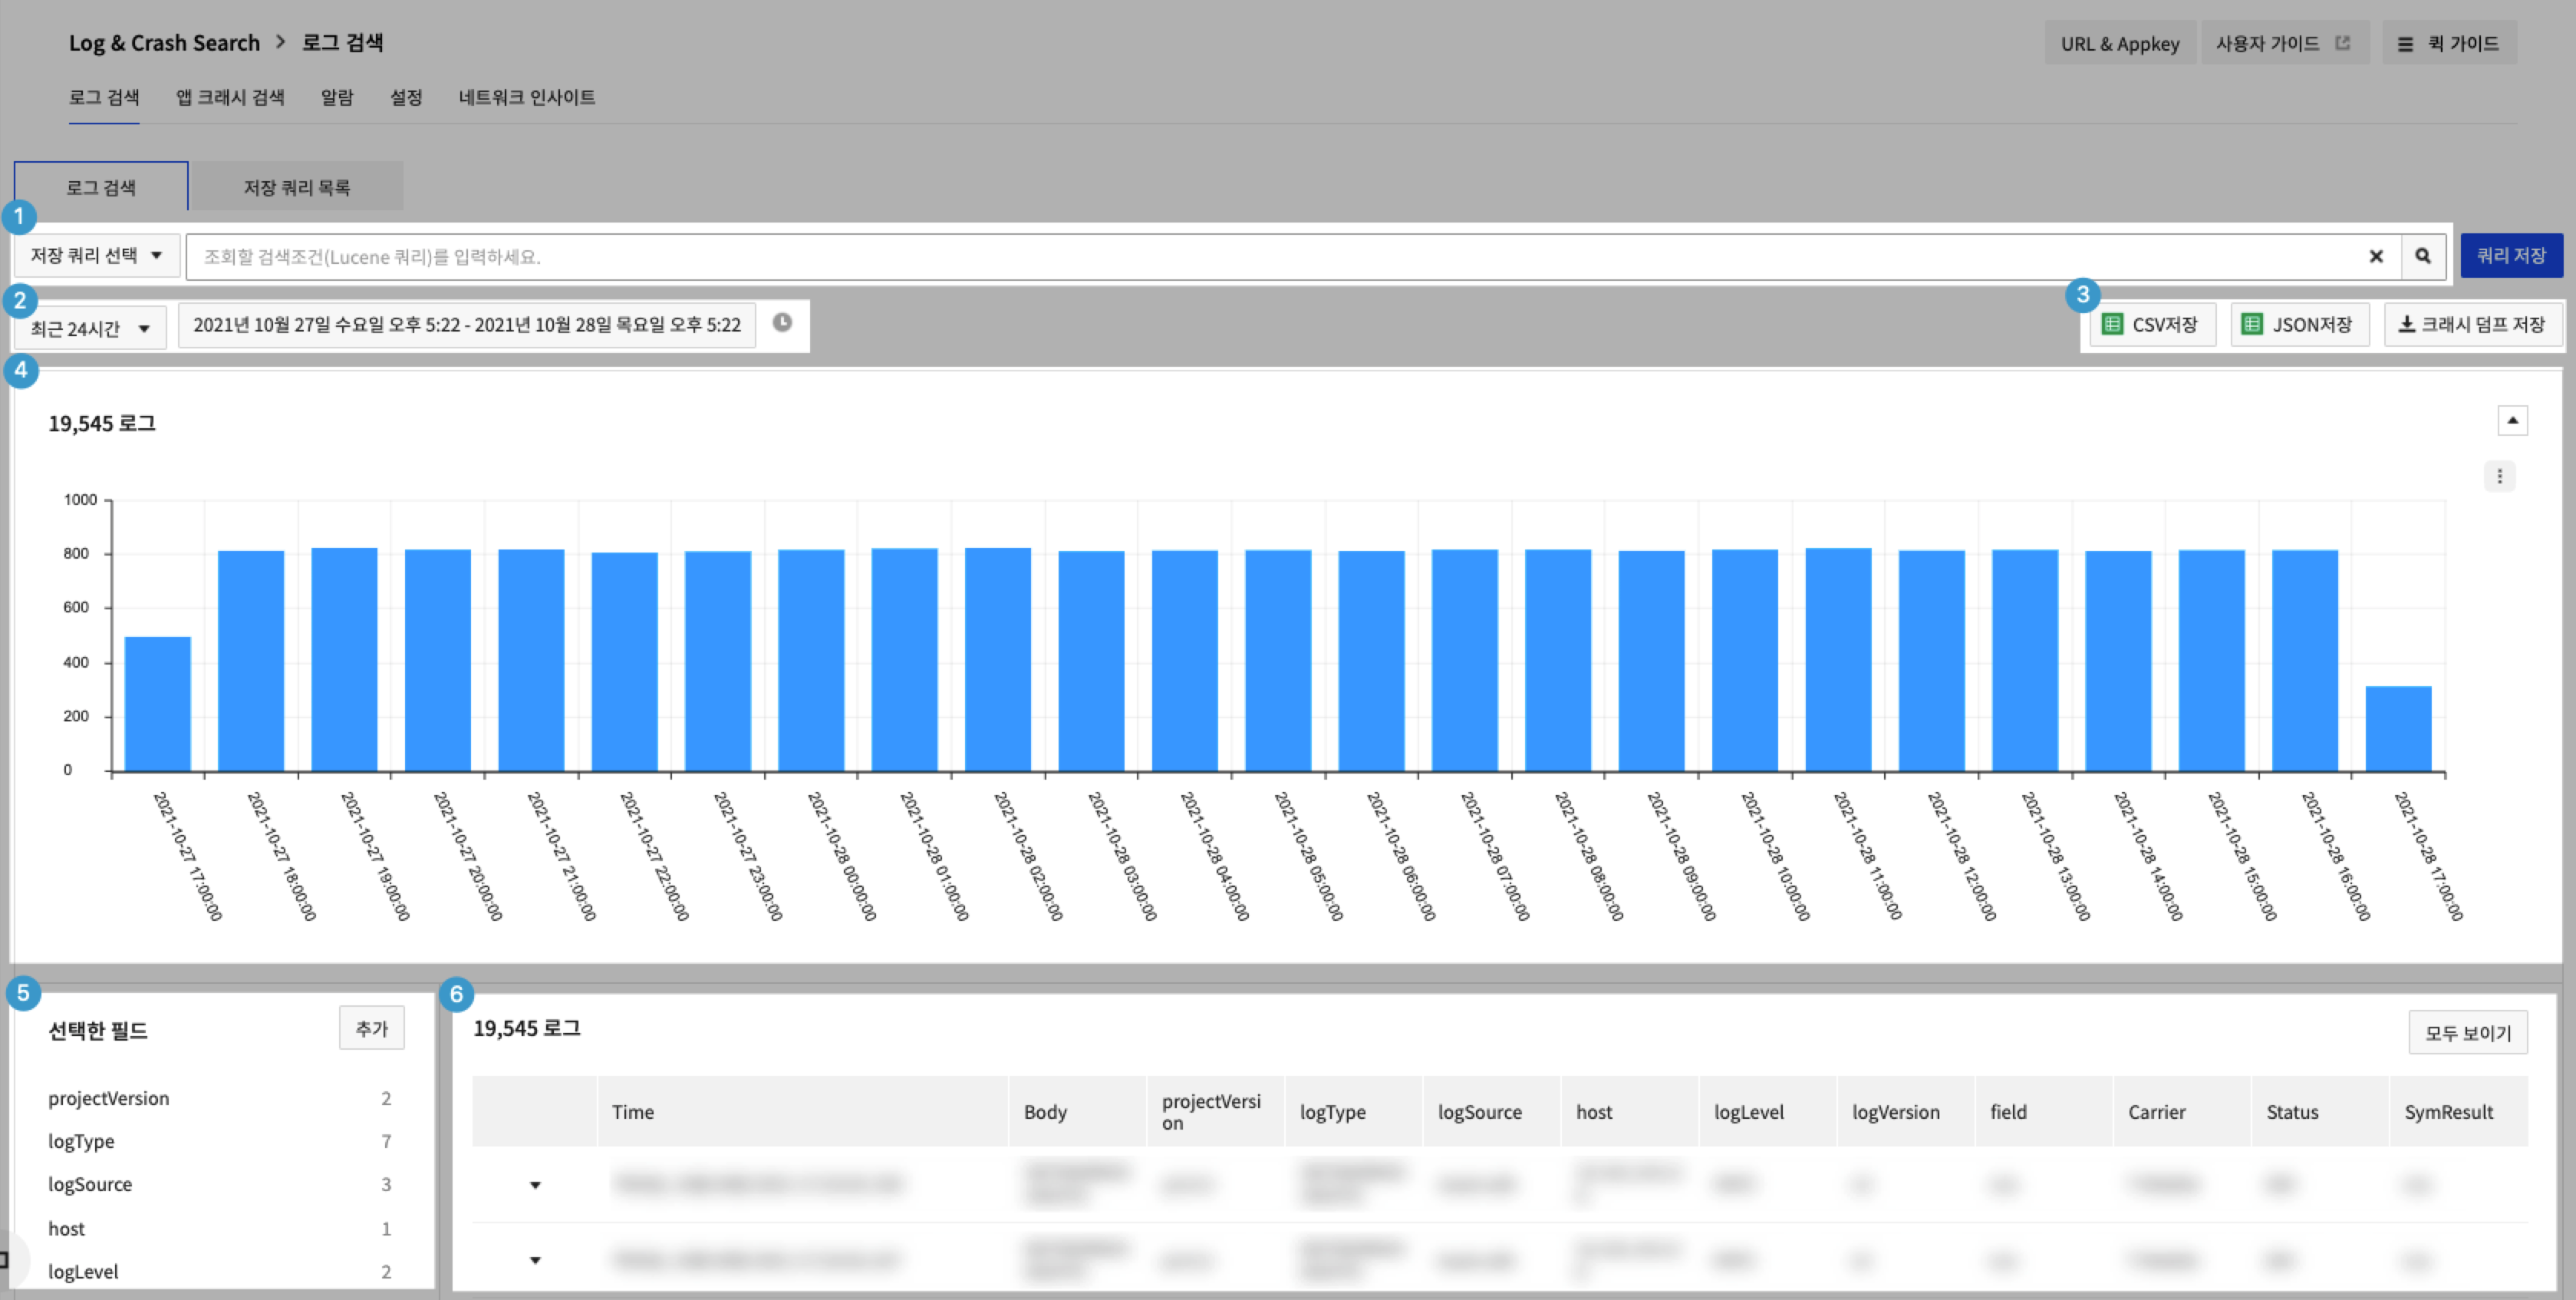
| Item | Description |
|---|---|
| Search Query Input | Can apply Lucene grammar for the search of query field. (Reference: https://docs.toast.com/ko/Data%20&%20Analytics/Log%20&%20Crash%20Search/ko/lucene-query-guide/) |
| Time Conditions for Search Query | Configure time conditions for search queries. |
| Log Search Result > Chart | The log search result is output as a bar graph. If you click a bar of the bar graph, you can check the log by re-searching for the log period of the bar. |
| Log Result Download | You can download log search results in a format you want. Also, you can download only crash dump data separately. |
| Selected Fields | You can change the result table column on the right side according to the log field. You can use the Add button to add or delete other fields. |
| Log Search Result > Log Records | Show details of a searched log. Click each item of a log output to change search queries. |
The search condition set by the user is reflected in the search query input window. If it is a frequently used query, you can save it using the Save Query button and retrieve it later. You can check and manage the saved queries in Saved Query List.
[Note] Logs containing fields with a data length greater than 1,000,000 characters are not searchable. For logs that cannot be queried due to the issue, please use the log download function to retrieve the logs until the issue is resolved.
Query App Crashes
Crash information of Android and iOS devices can be retrieved through Data & Analytics > Log & Crash Search > App Crash Search.
Query Issues
Select Crashes on Error Type of Query Issues to check issues.
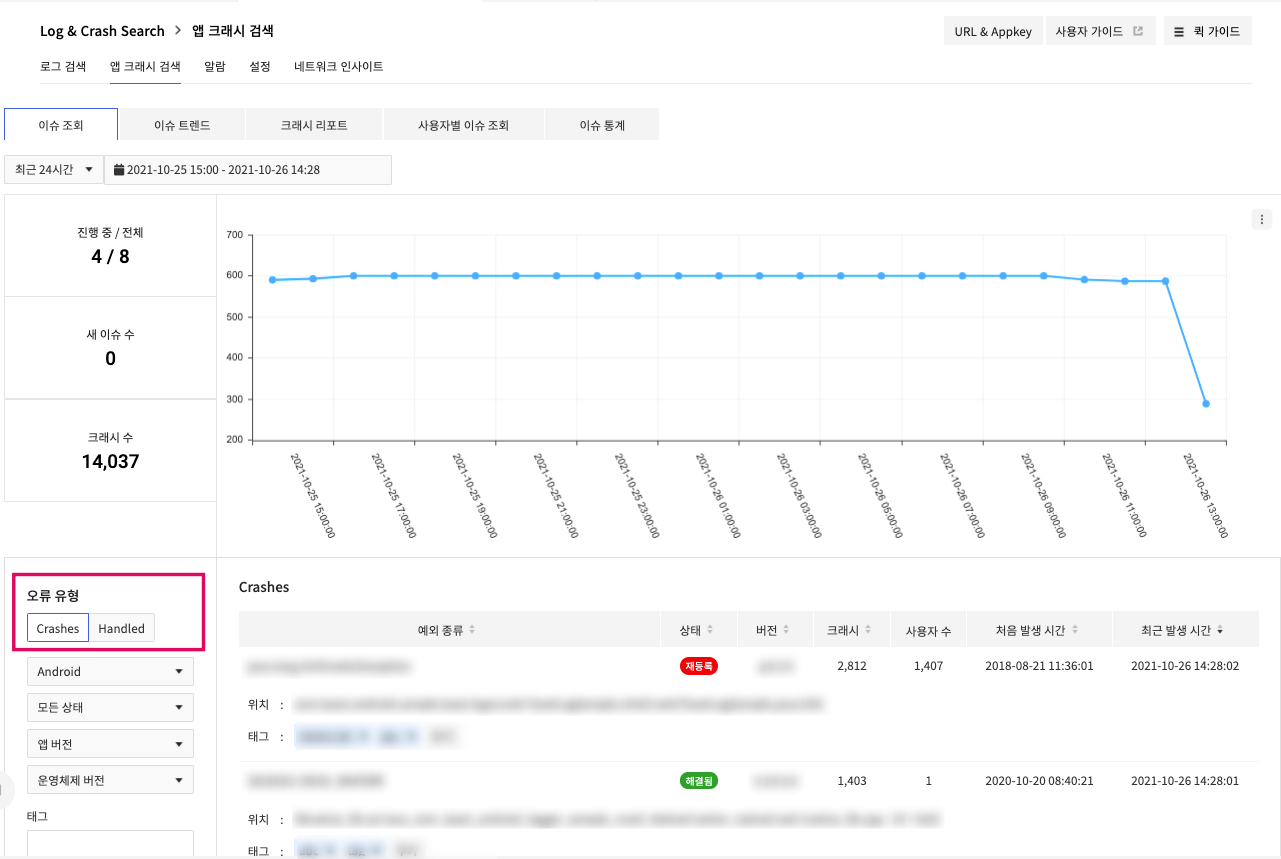
Select Handled on Error Type of Query Issues, to check handled issues.
| Item | Description |
|---|---|
| Chart | Display the number of crash occurrences on a timeline chart. |
| Error Type | Classified into Crash occurred at a system and user-induced Handled at an exception block. |
| Filter Conditions | Platform - Select app platform Status - Crash issue handling status App Version - App version OS Version - OS version Tag – Tags Minimum Number of Occurrences – Retrieving filter of crashes with at least more than N times of occurrences Exception Type – Recent filter for each exception type Location – Retrieving filter for each location of crash occurrence |
| List of Issues | Print the list of issues. The order can be changed by using the list box in the upper right; the status can be changed by clicking the checkbox on the left. |
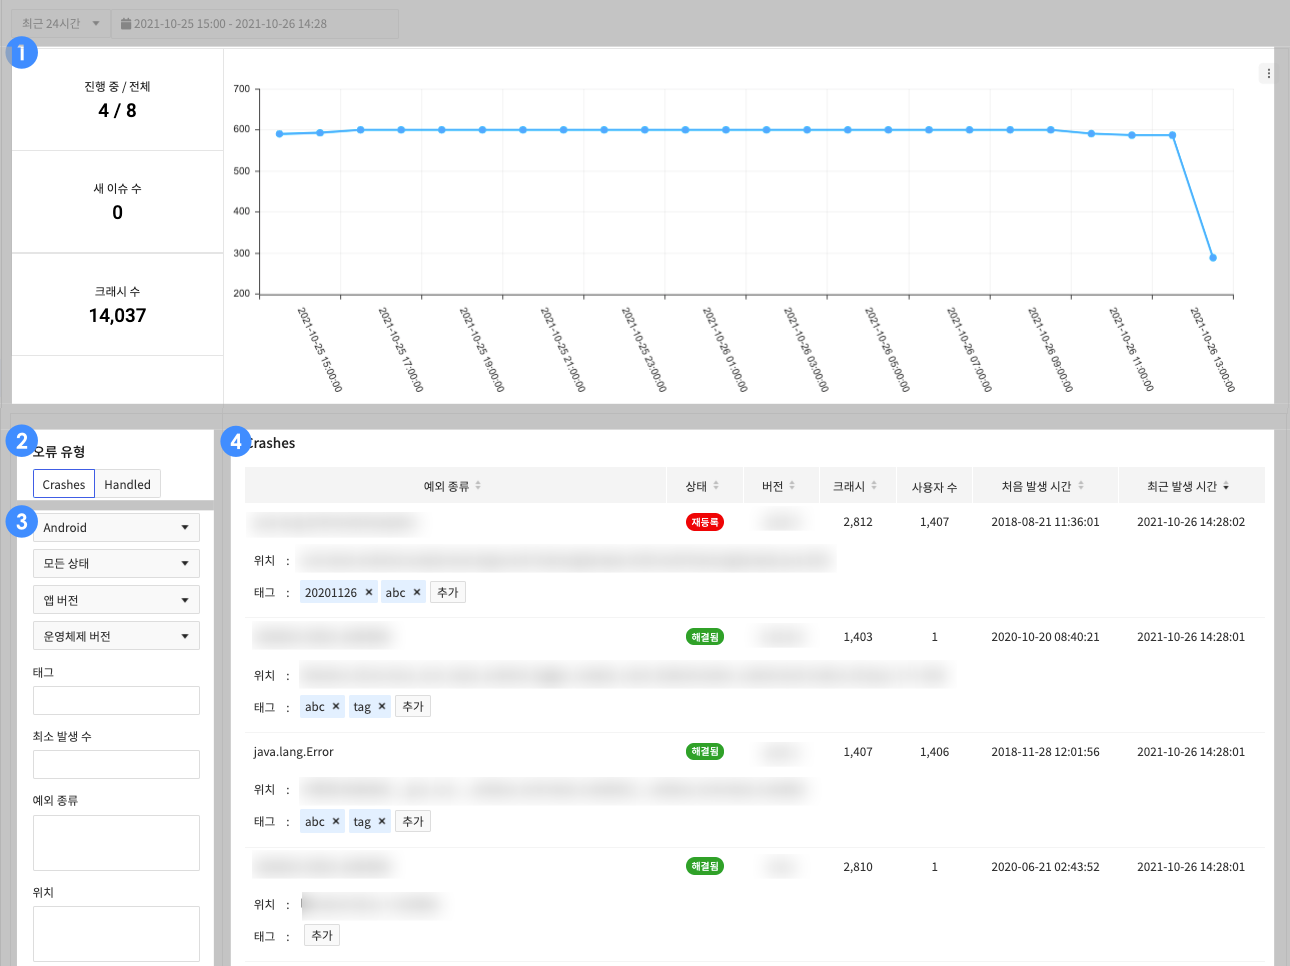
Click an issue on the list to find its details.
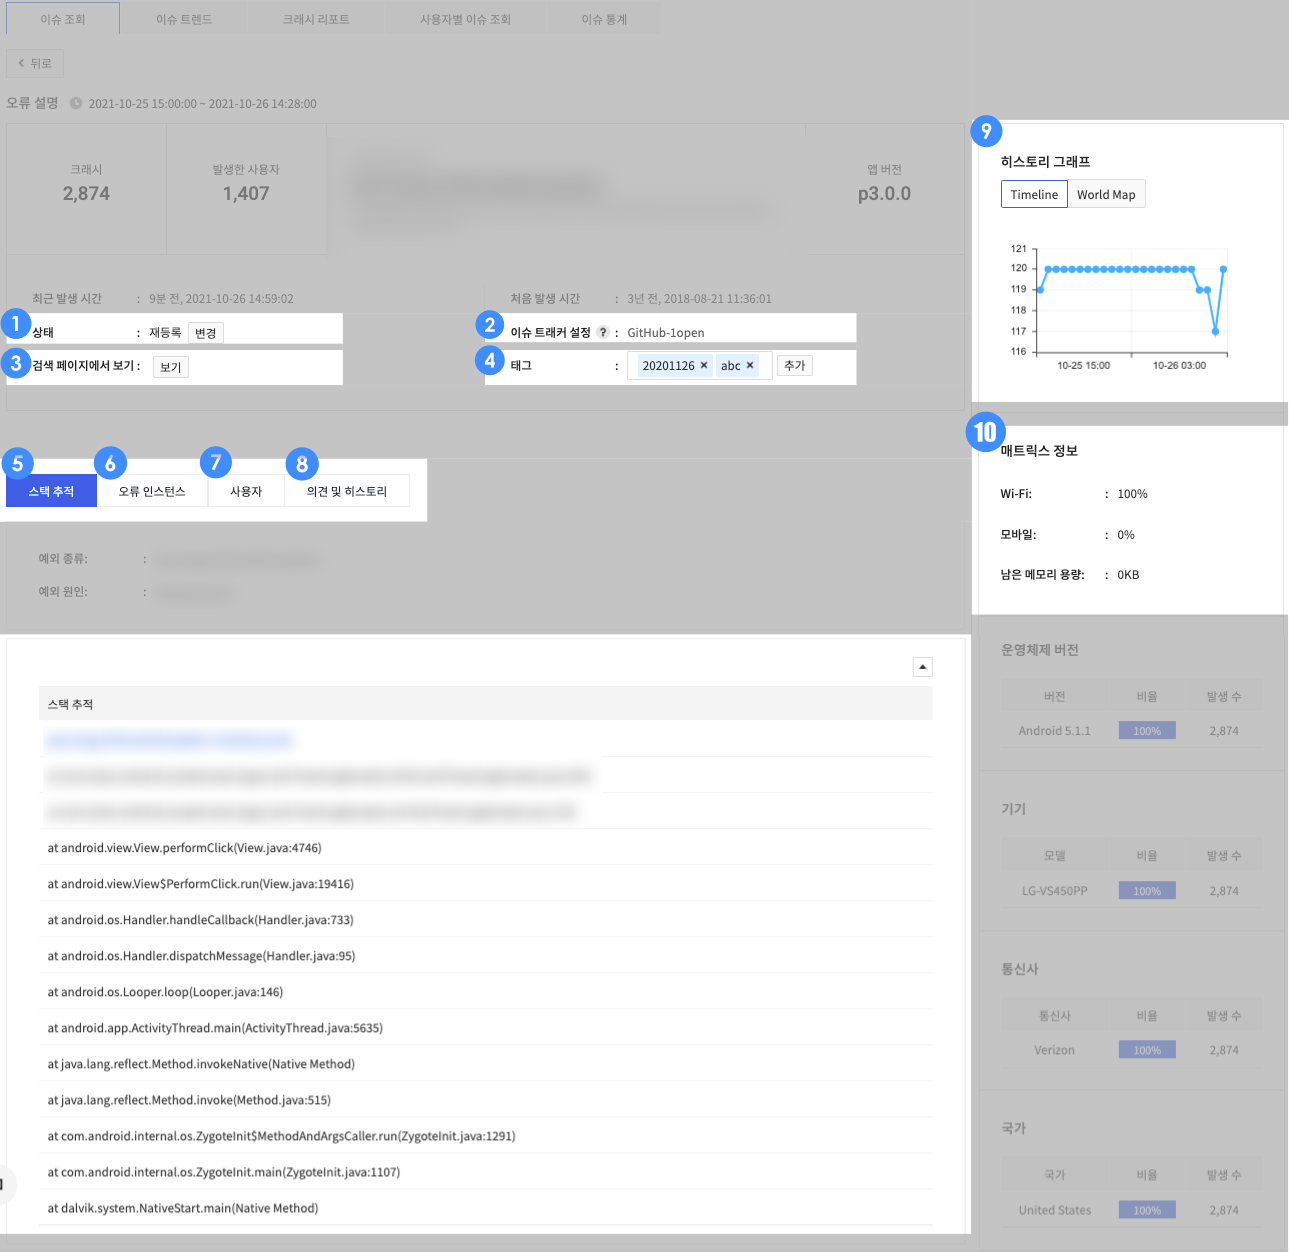
| Item | Description |
|---|---|
| Status | Set issue status as unresolved, resolved, re-open, or completed. |
| Issue Tracker Setup | Register issues by setting up external issue trackers, such as GitHub or GitLab. |
| View on Search Page | Click to go to the log search page |
| Tag | Add tags, or modify/delete them afterwards. |
| Stack Trace | Show the type and cause of exception for crash occurrence as well as the stack trace. |
| Error Instance | Show the list of error instances. |
| User | Show the list of users who have occurred issues. |
| Comment and History | You can write comments on the issue. This area displays the list of comments written by project members and shows management history of an issue (status change, tags added, comments added, etc.) on a timeline. |
| History Graph | Trace the number of issue occurrences on a timeline chart and a world map. |
| Matrix Data | Display information such as network, OS version, device, operator, and nation. |
Issue Trend
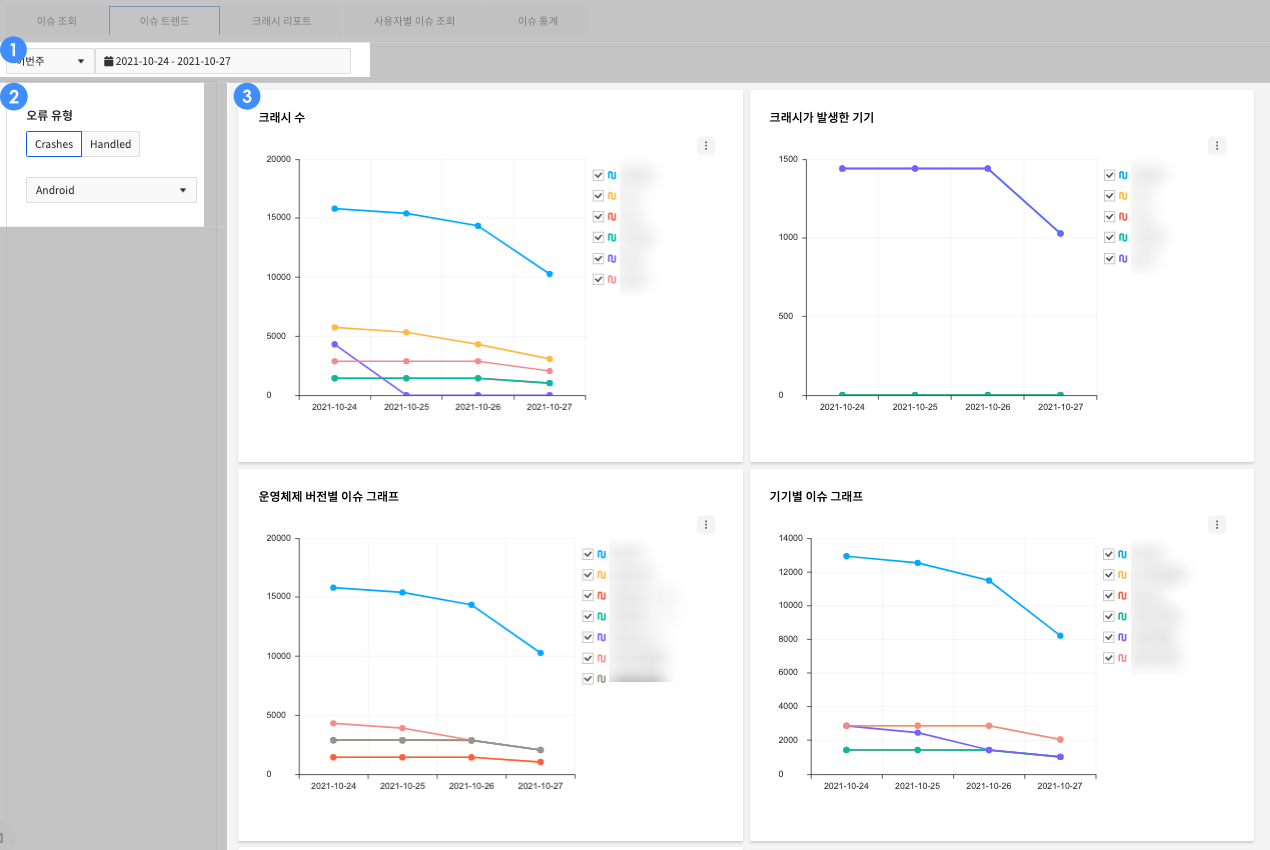
| Item | Description |
|---|---|
| Time Condition | You can set the time condition for statistics. |
| Search Criteria | Error Type - Select between Crashes / Handled Platform - Select app platform |
| Trend Graph | You can see various trend graphs. - Number of crashes - Device where a crash occurred - Issues by OS version - Issues by device - Issues by country |
Crash Report
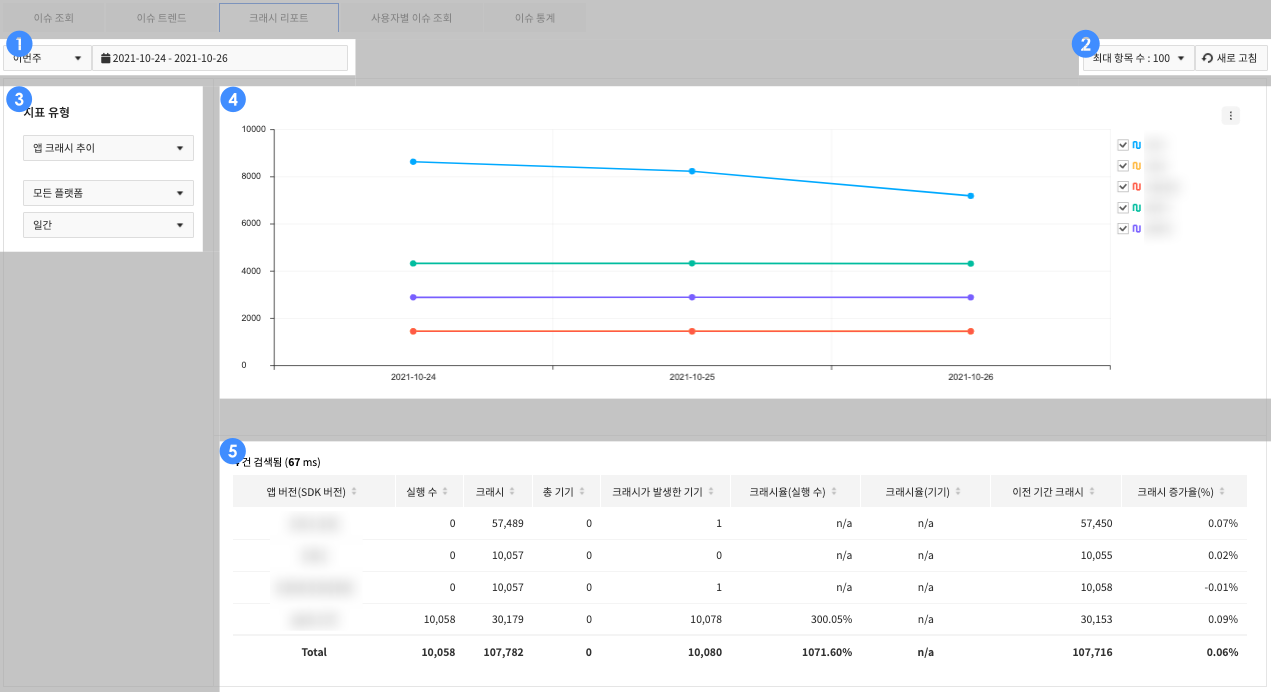
| Item | Description |
|---|---|
| Time Condition | You can set the time condition for statistics. |
| Query Option | You can adjust the number of searches. |
| Search Criteria | Metrics Type - Currently only "App Crash Trend" is provided Platform - Select app platform Statistics Time Unit - Select time unit for graph metrics (daily / weekly) |
| Crash Graph | Shows the number of crashes within the search period. |
| Crash Metrics | Provides information on the session count/crash count/occurrence rate (%)/crash count in the previous period/increase rate (%) by app version within the search period. |
Query Issues by User
Provide crash occurrence information per user.
- Available when user_id is defined in an SDK: if not saved, all users are viewed as '-'.
- A user is identified by the combination of a user ID and a device name: users of a same user ID but on different devices are considered different users.
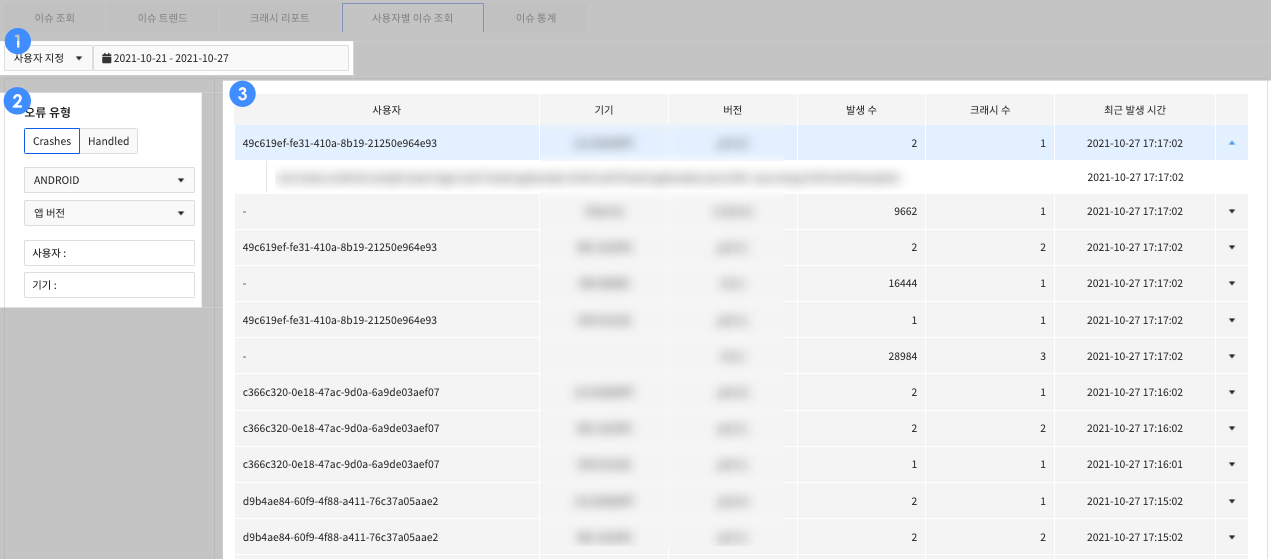
| Item | Description |
|---|---|
| Time Condition | You can set the time condition for statistics. |
| Search Criteria | Error Type - Crash: statistics of crashes generated by the system, Handled: statistics of crashes generated by user in Exception block Platform - App platform App Version - App version User - User ID specified by user_id in SDK Device - Device Name |
| User Information | Shows information about the app crash user (device, app version, etc.). |
Issue Statistics
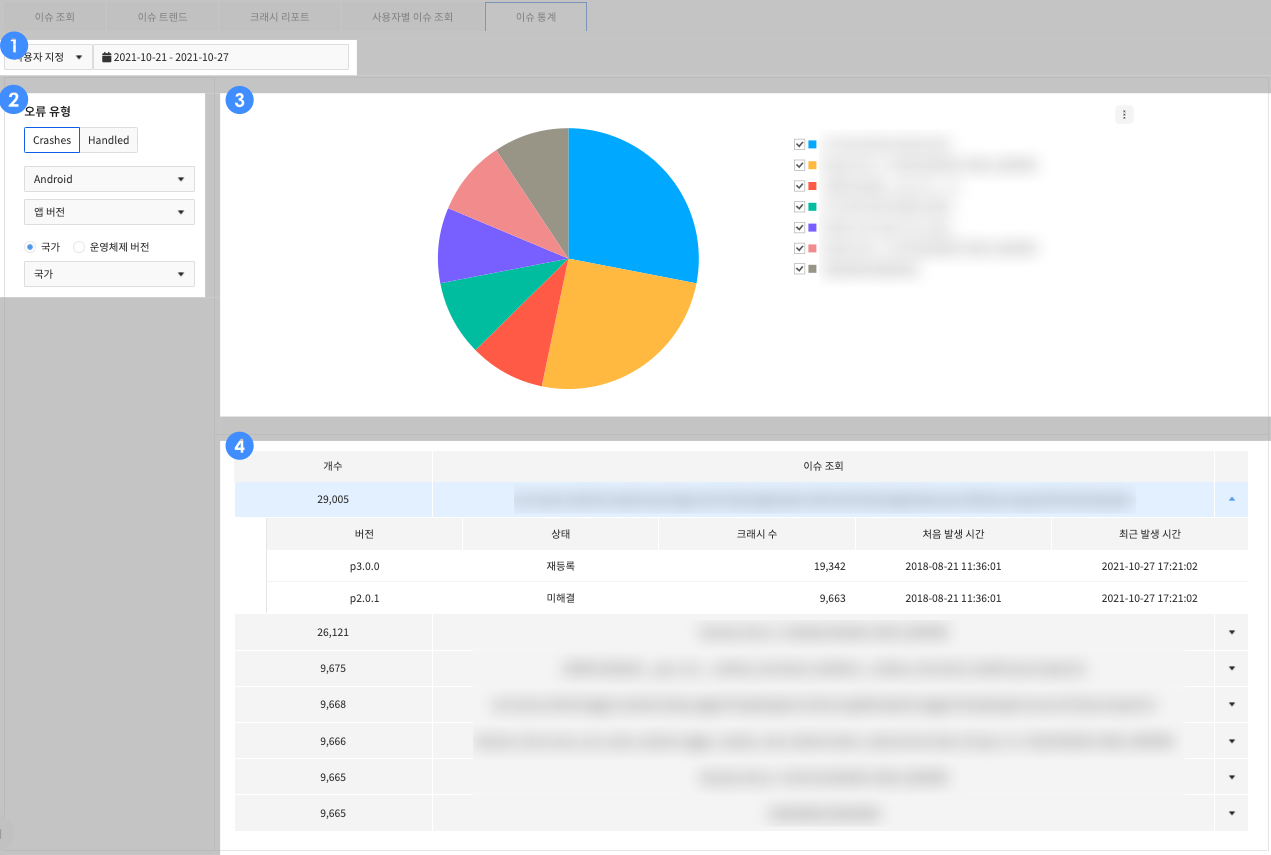
| Item | Description |
|---|---|
| Time Condition | Set time conditions for statistics. |
| Search Criteria | Error Type - Crash: statistics of crashes generated by the system, Handled: statistics of crashes generated by user in Exception block Platform - App platform App Version - App version Country - Country of the user who experienced the issue < br/> OS version - OS version of the device where the issue occurred |
| Pie Chart for Frequency of Crash Occurrence | Show frequency of each crash occurrence. |
| Ranking Table for Frequency of Crash Occurrence | Show the ranks of frequency of crash occurrence. |
Alarm
Set alarms for log and crash, and check history of alarm delivery. Click Data & Analytics > Log & Crash Search > Alarms.
Log Alarm Setting
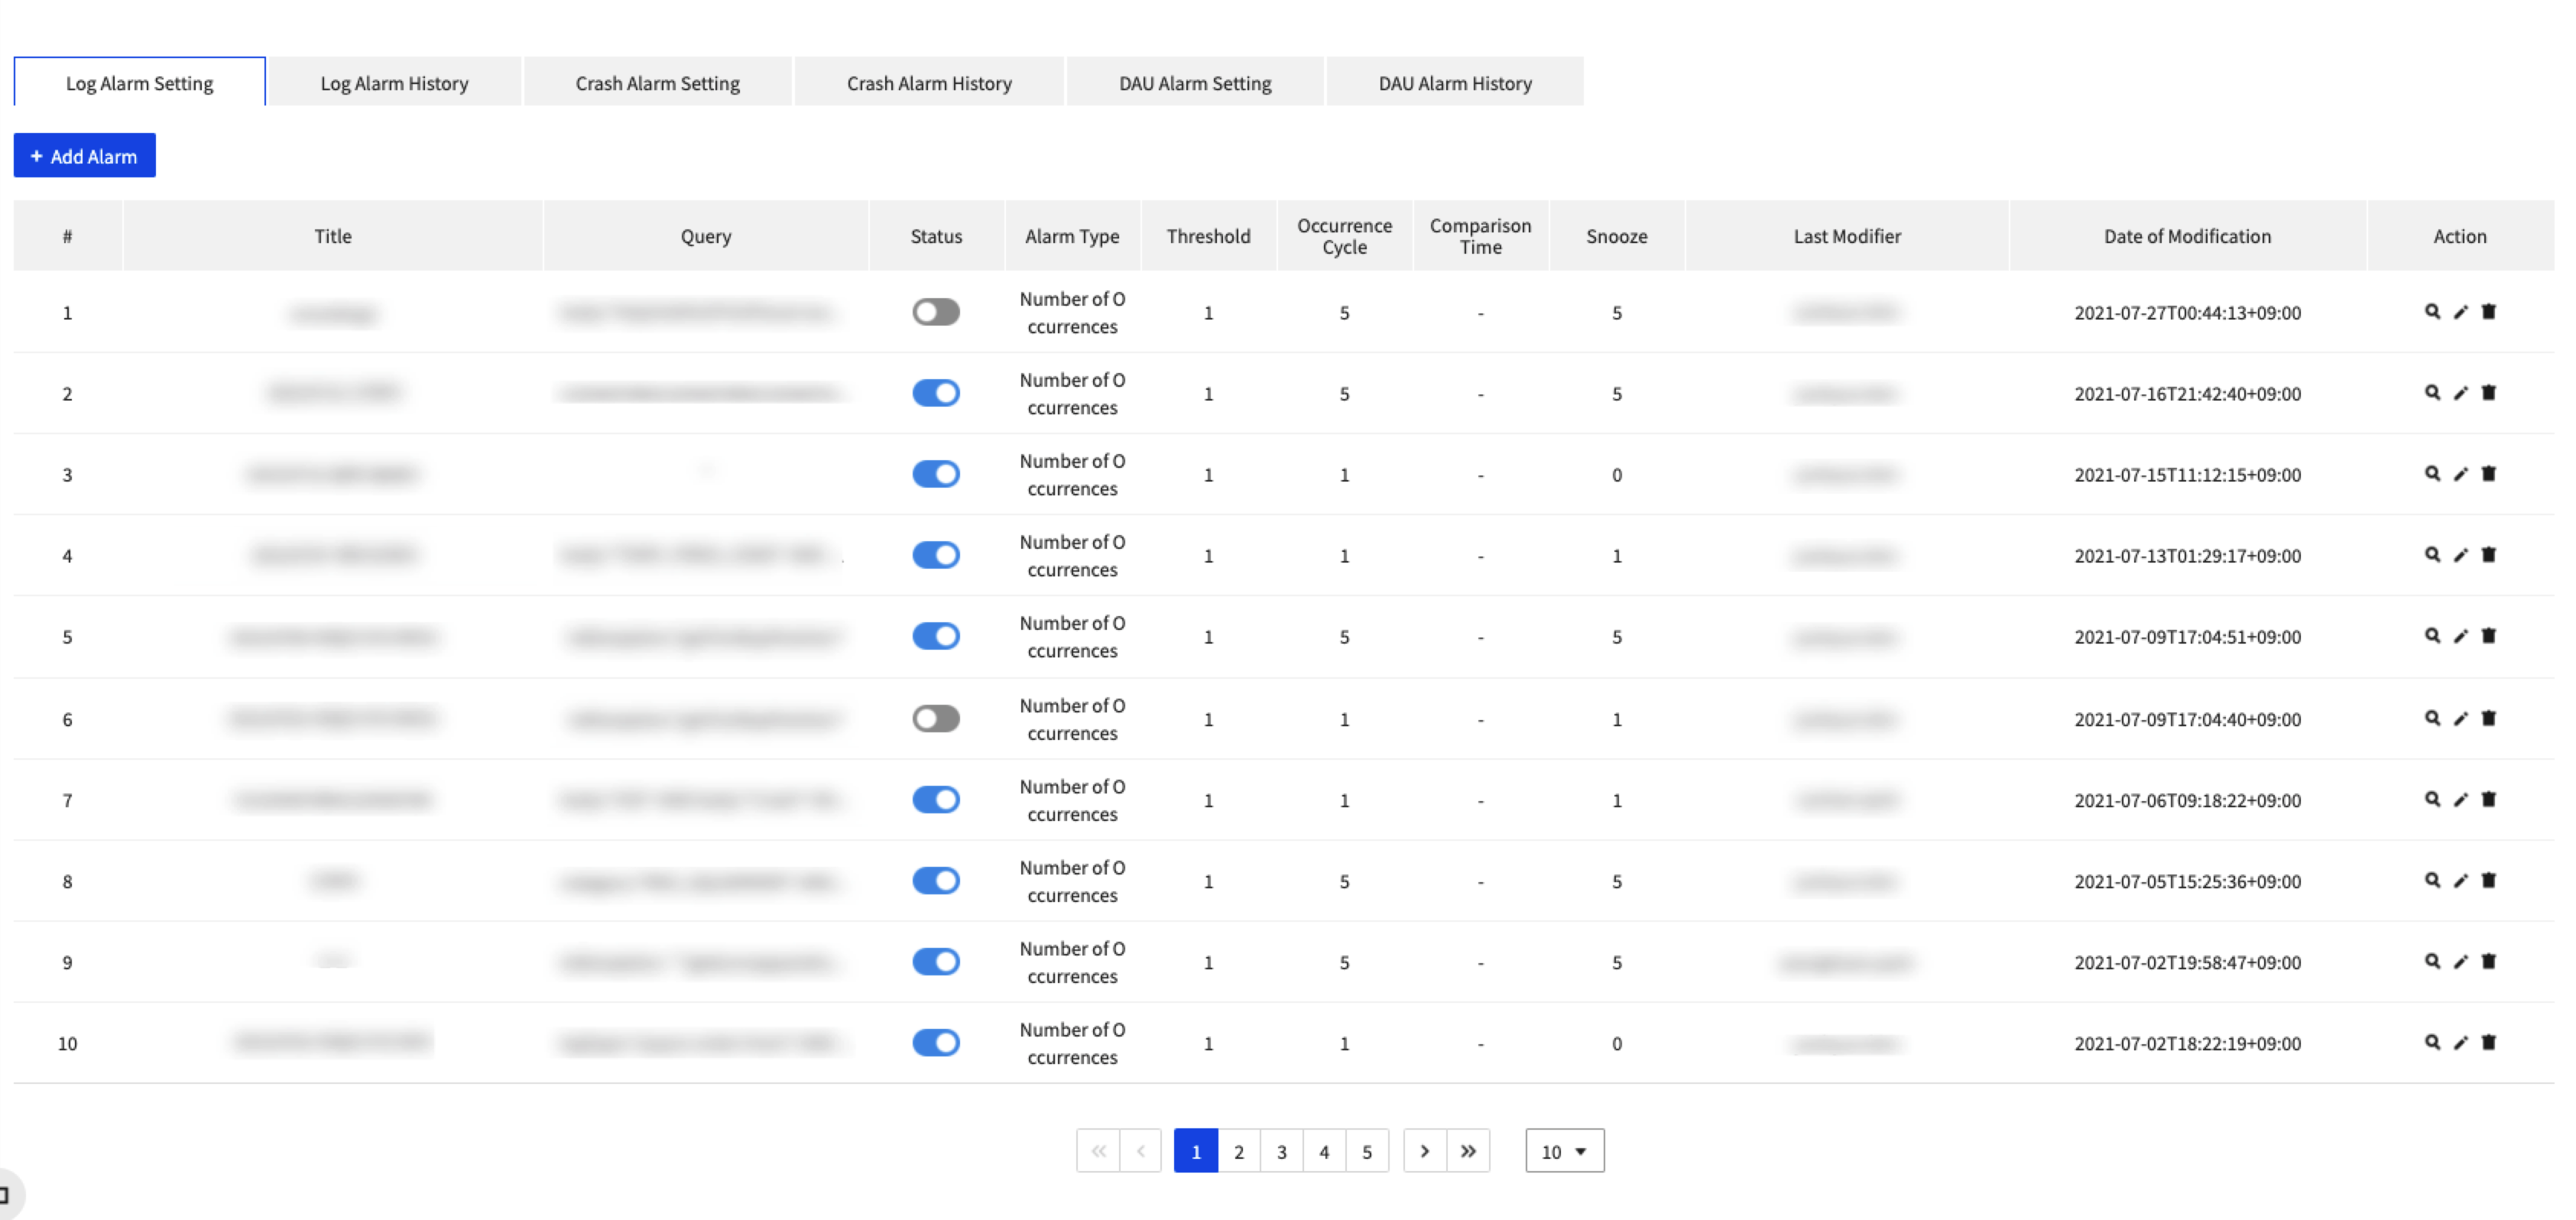
Provide all log alarm functions:
- Alarms are classified by the number of occurrences and by the rate of increase/decrease.
- Register a log type (Lucene query) to receive alarms and send alarms depending on the conditions when a log occurs.
- Alarms exist in two types: Number of Occurrences, and Rate of Increase/Decrease.
- Click Add Alarms to register an alarm.
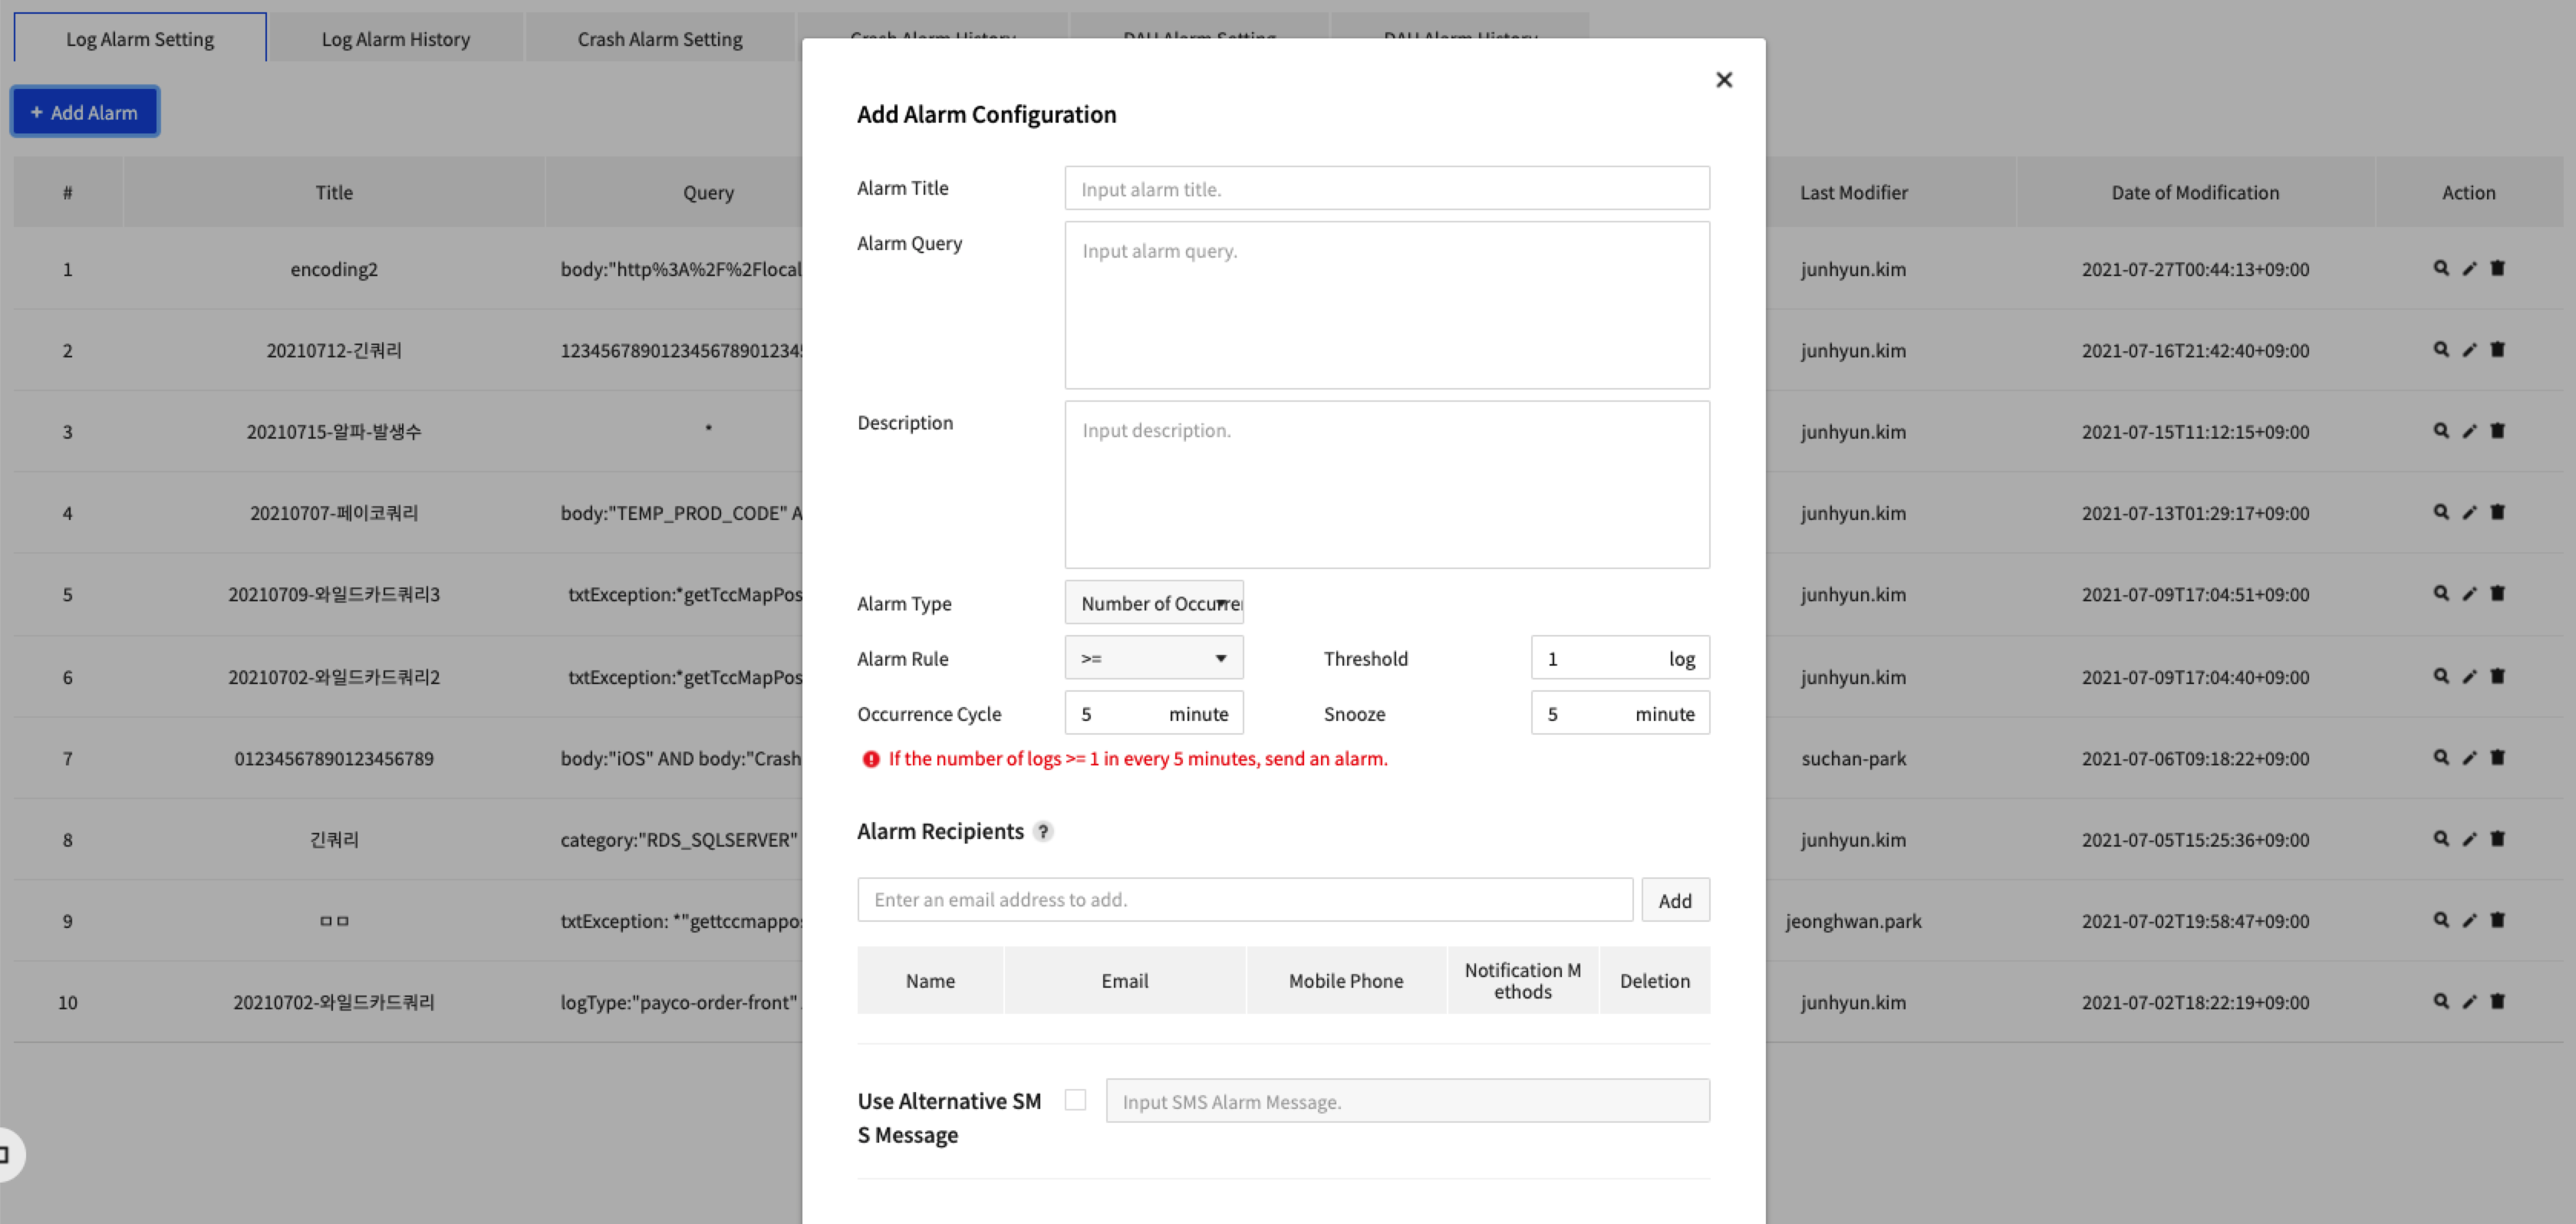
- The following describes how to set an alarm.
- Alarm Title: Enter name to show on the list of alarm setting.
- Alarm Query: Enter a log type to receive alarms for in Lucene Query.
- Description: Enter a description of the alarm.
- Alarm type: Set the alarm type by the number of occurrence or increase/decrease rate
- When the alarm type is the number of occurrence
- Alarm Rule: Select the inequality sign to be applied to the Threshold.
- Threshold: An alarm is sent when the number of generated logs corresponding to 'Search Condition' matches the number of 'Threshold' in relation to the 'Alarm Rule' inequality sign.
- Occurrence Cycle: Enter the value in minutes. An alarm is sent only when the number of generated logs matches 'Threshold' within the entered time value.
- When the alarm type is increase/decrease rate
- Threshold: Increase/decrease rate of the logs corresponding to the 'Search Condition'. A positive number is the increase rate of logs compared to the previous interval, 0 means that the number of logs is equal to the previous interval, and a negative number is the decrease rate of logs compared to the previous interval.
- Comparison Time: Enter the value in minutes. The number of logs between the entered time interval and the previous interval is compared based on the 'Threshold Value'. An alarm is sent if the increase/decrease rate of the logs generated during the 'Comparison Time' satisfies the 'Threshold'.
- Snooze: Enter by the minute, between 1 and 1,440 (24 hours); off for 0.
- Recipient: Enter recipients to send an alarm to; choose email or SMS for each recipient.
- SMS Alarm Messages: Enter SMS messages to send alarms with.
- Callback URL: Enter URL to call when an alarm is sent. http(s)://, Email, and Dooray hook are supported.
Log Alarm History
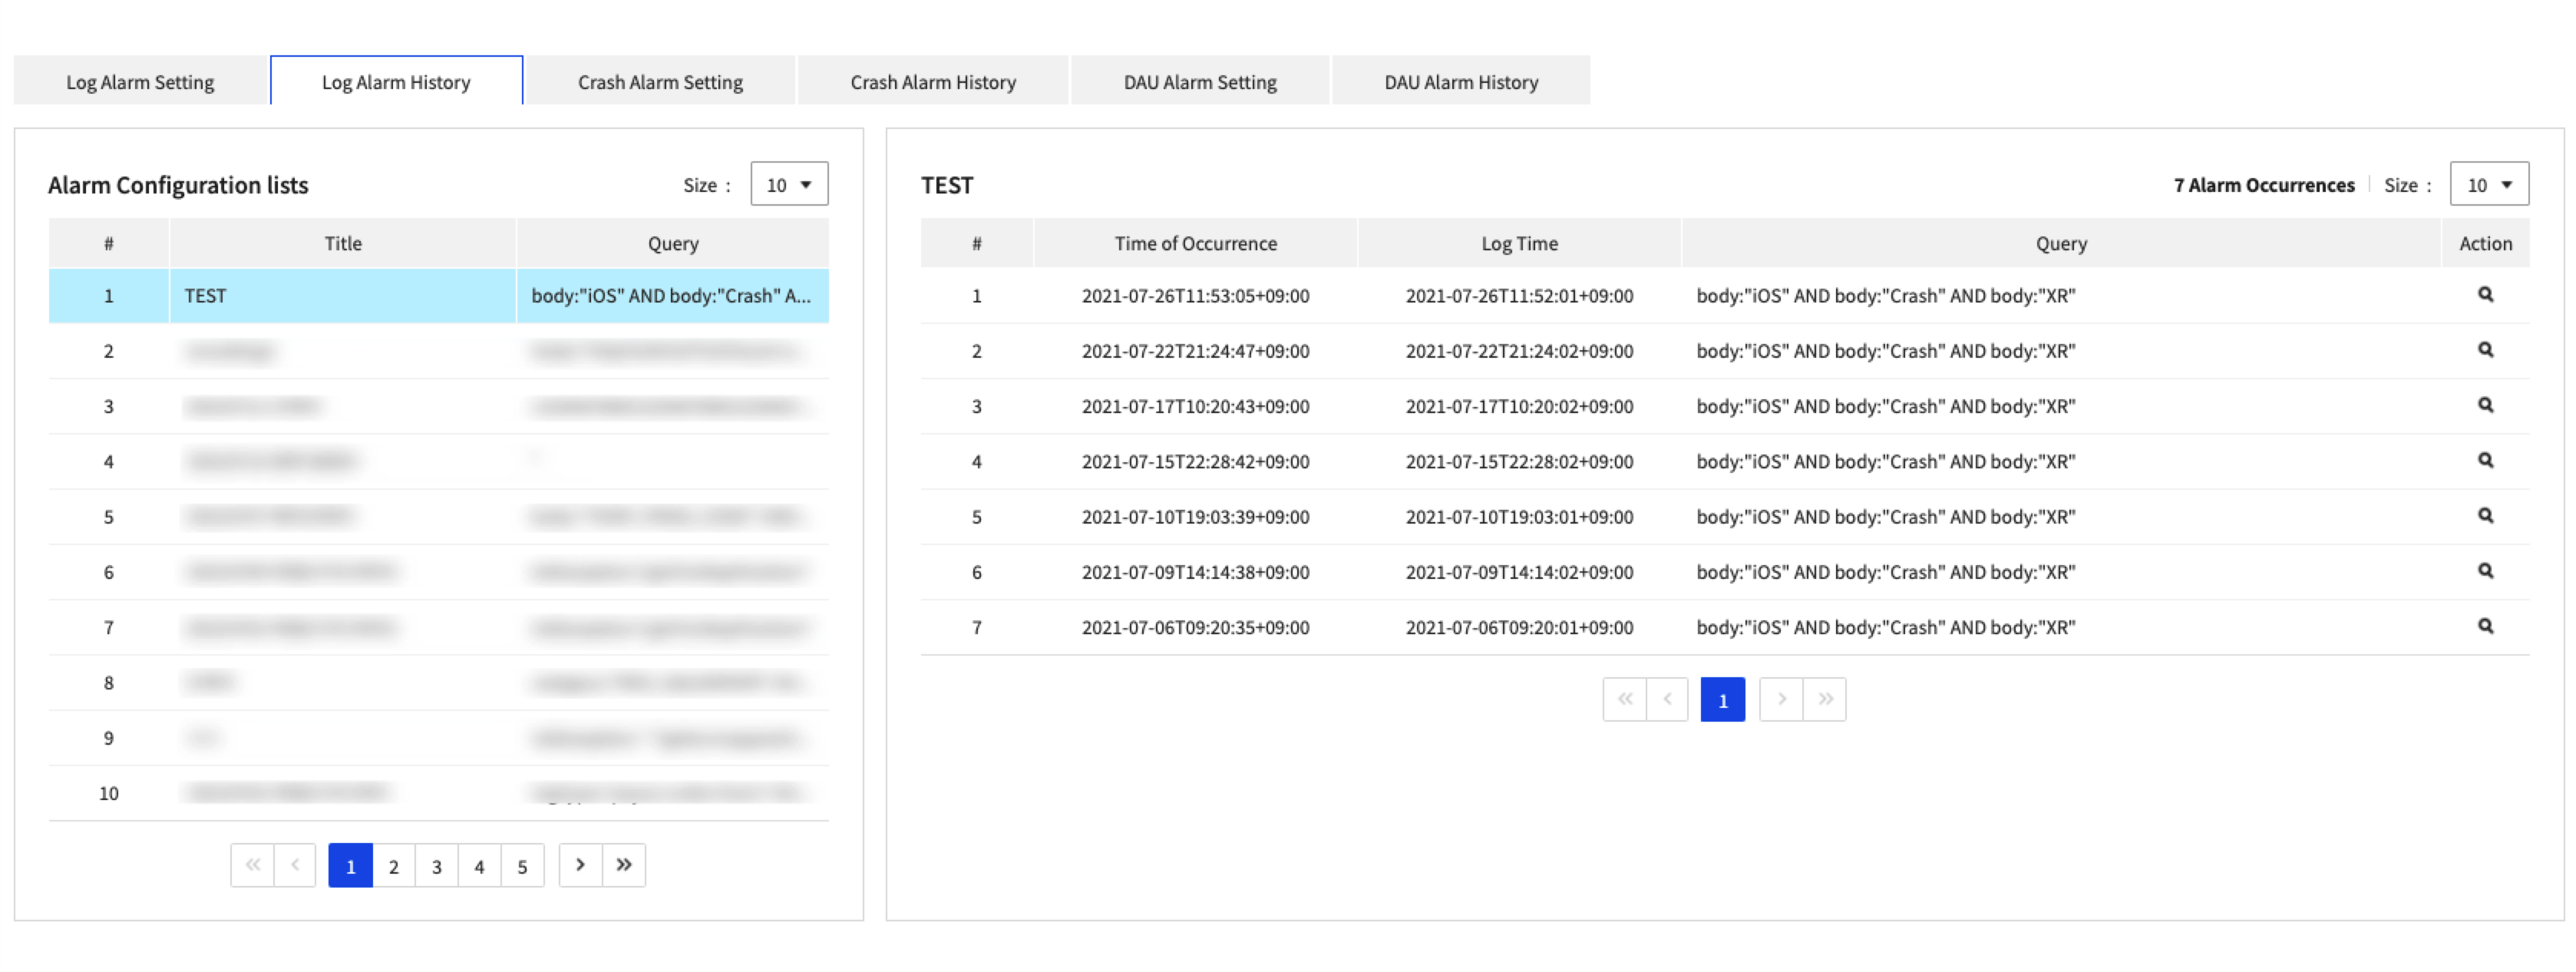
- A list of configured alarms is displayed.
- Click the list to check the alarm occurrence history.
Crash Alarm Setting
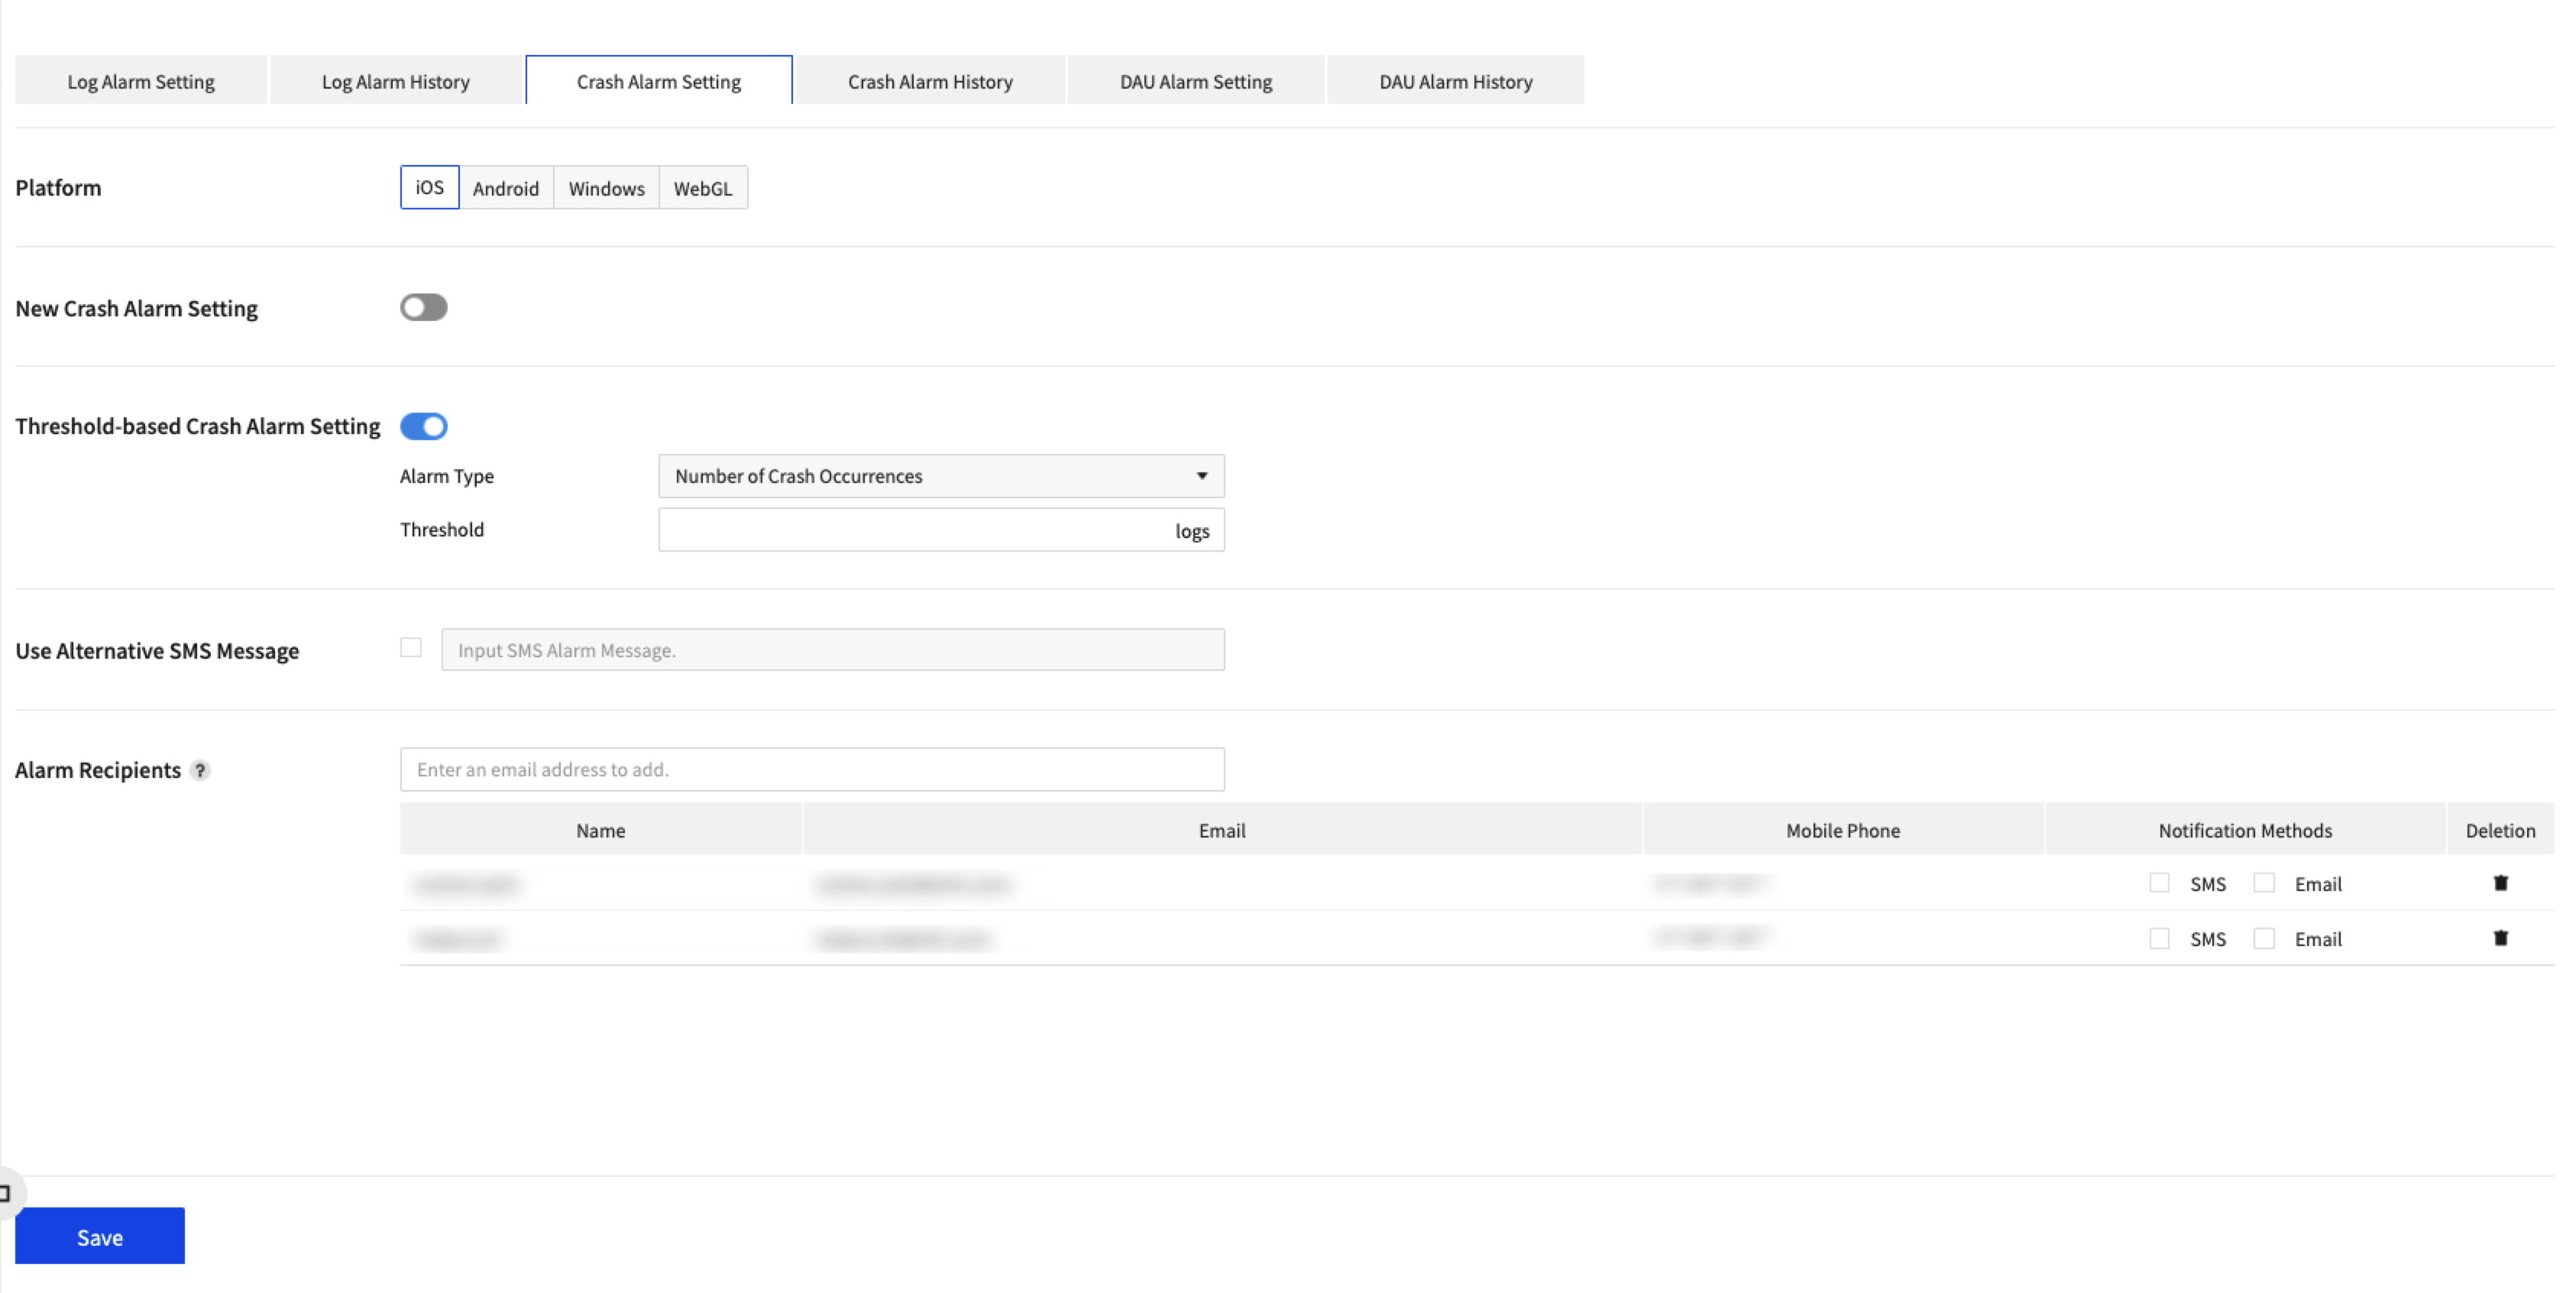
Set alarm for each crash log: one for each platform (iOS, Android, Windows, and WebGL).
To set an alarm:
- Platform: Specify a platform to send alarms among iOS, Android, Windows, or WebGL.
- New Crash Alarm Setting: Set On/Off for alarm occurrences.
- Threshold-based Crash Alarm Setting: Select frequency of crash occurrence or average frequency to enter threshold. The detection cycle is 10 minutes.
- Alarm Type: There are two types: Number of Crash Occurrences and Rate of Increase/Decrease.
- Threshold: Set number of logs for 'Number of Crash Occurrences' type and percentage for 'Rate of Increase/Decrease'.
- Use Alternative SMS Message: When enabled, custom alarm messages will be delivered via SMS, in place of default error messages,
- Alarm Recipients: Select email or SMS of users who decide to receive alarms from the list of project members.
Crash Alarm History
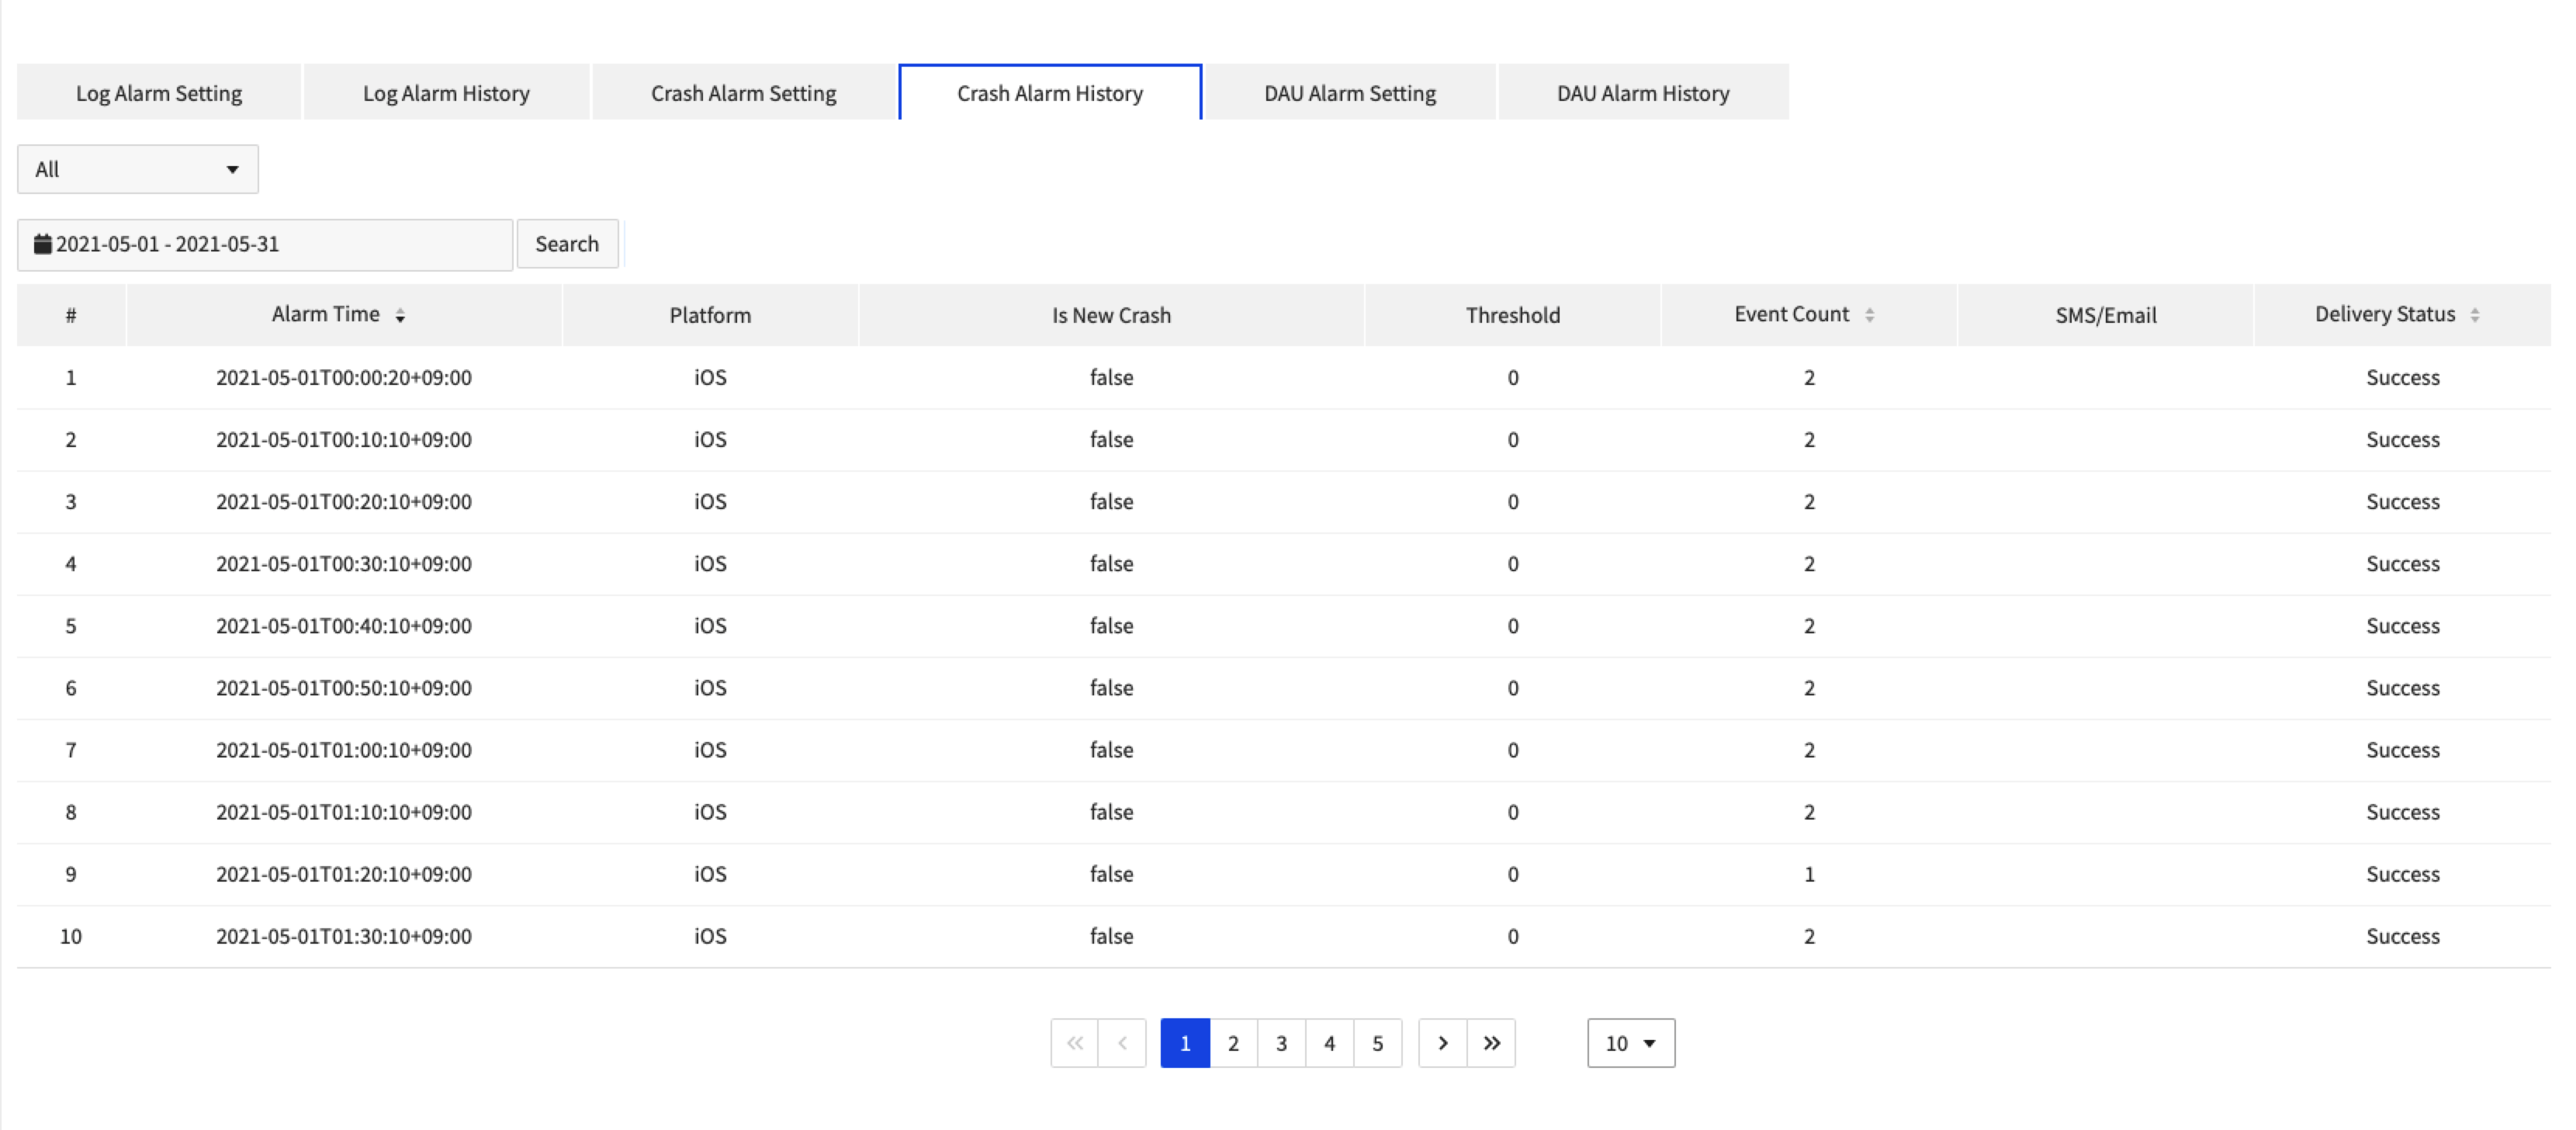
Retrieves the history of crash alarm occurrences.
- You can view the alarm history by platform.
- You can set time condition to adjust query period.
- Information on alarm time, platform, crash type, threshold, event count, and delivery method/status is provided.
User-defined Alarm Setting
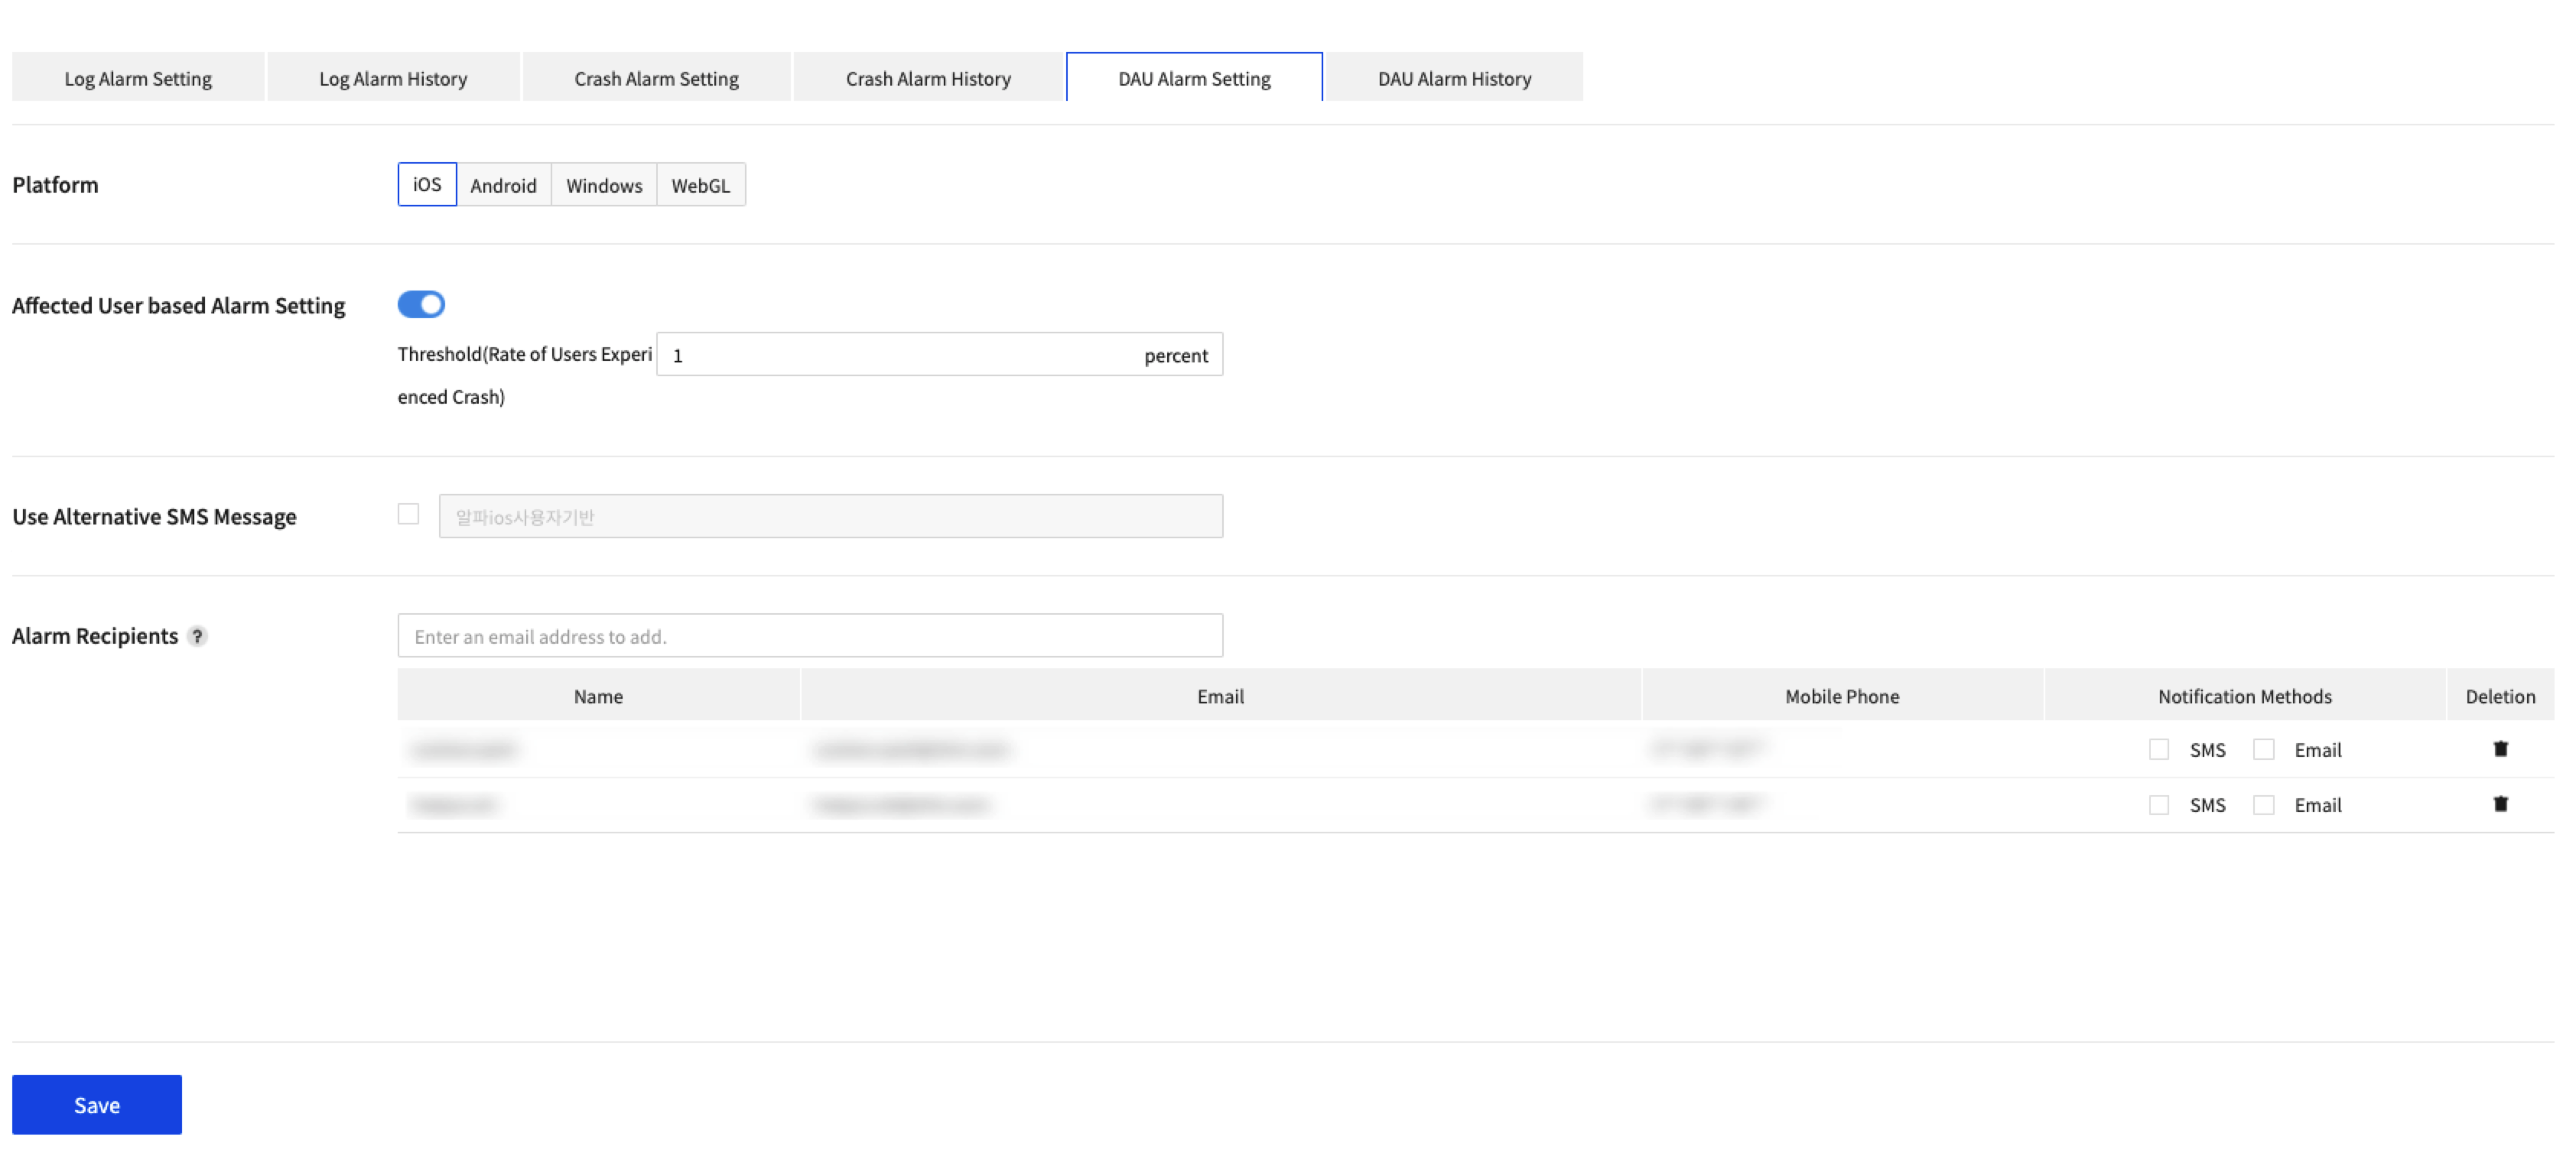
When the rate of users experiencing crash exceeds threshold (%), alarm is sent to specified phone or email of the users.
To set an alarm:
- Platform: Specify a platform to send alarms among iOS, Android, Windows, or WebGL.
- Affected User based Alarm SettingAlarm Setting: Set On/Off for alarm occurrences.
- Threshold(Rate of Users Experienced Crash): Set the rate of users who experienced crash..
- Use Alternative SMS Message: When enabled, custom alarm messages will be delivered via SMS, in place of default error messages,
- Alarm Recipients: Select email or SMS of users who decide to receive alarms from the list of project members.
User-defined Crash Alarm History
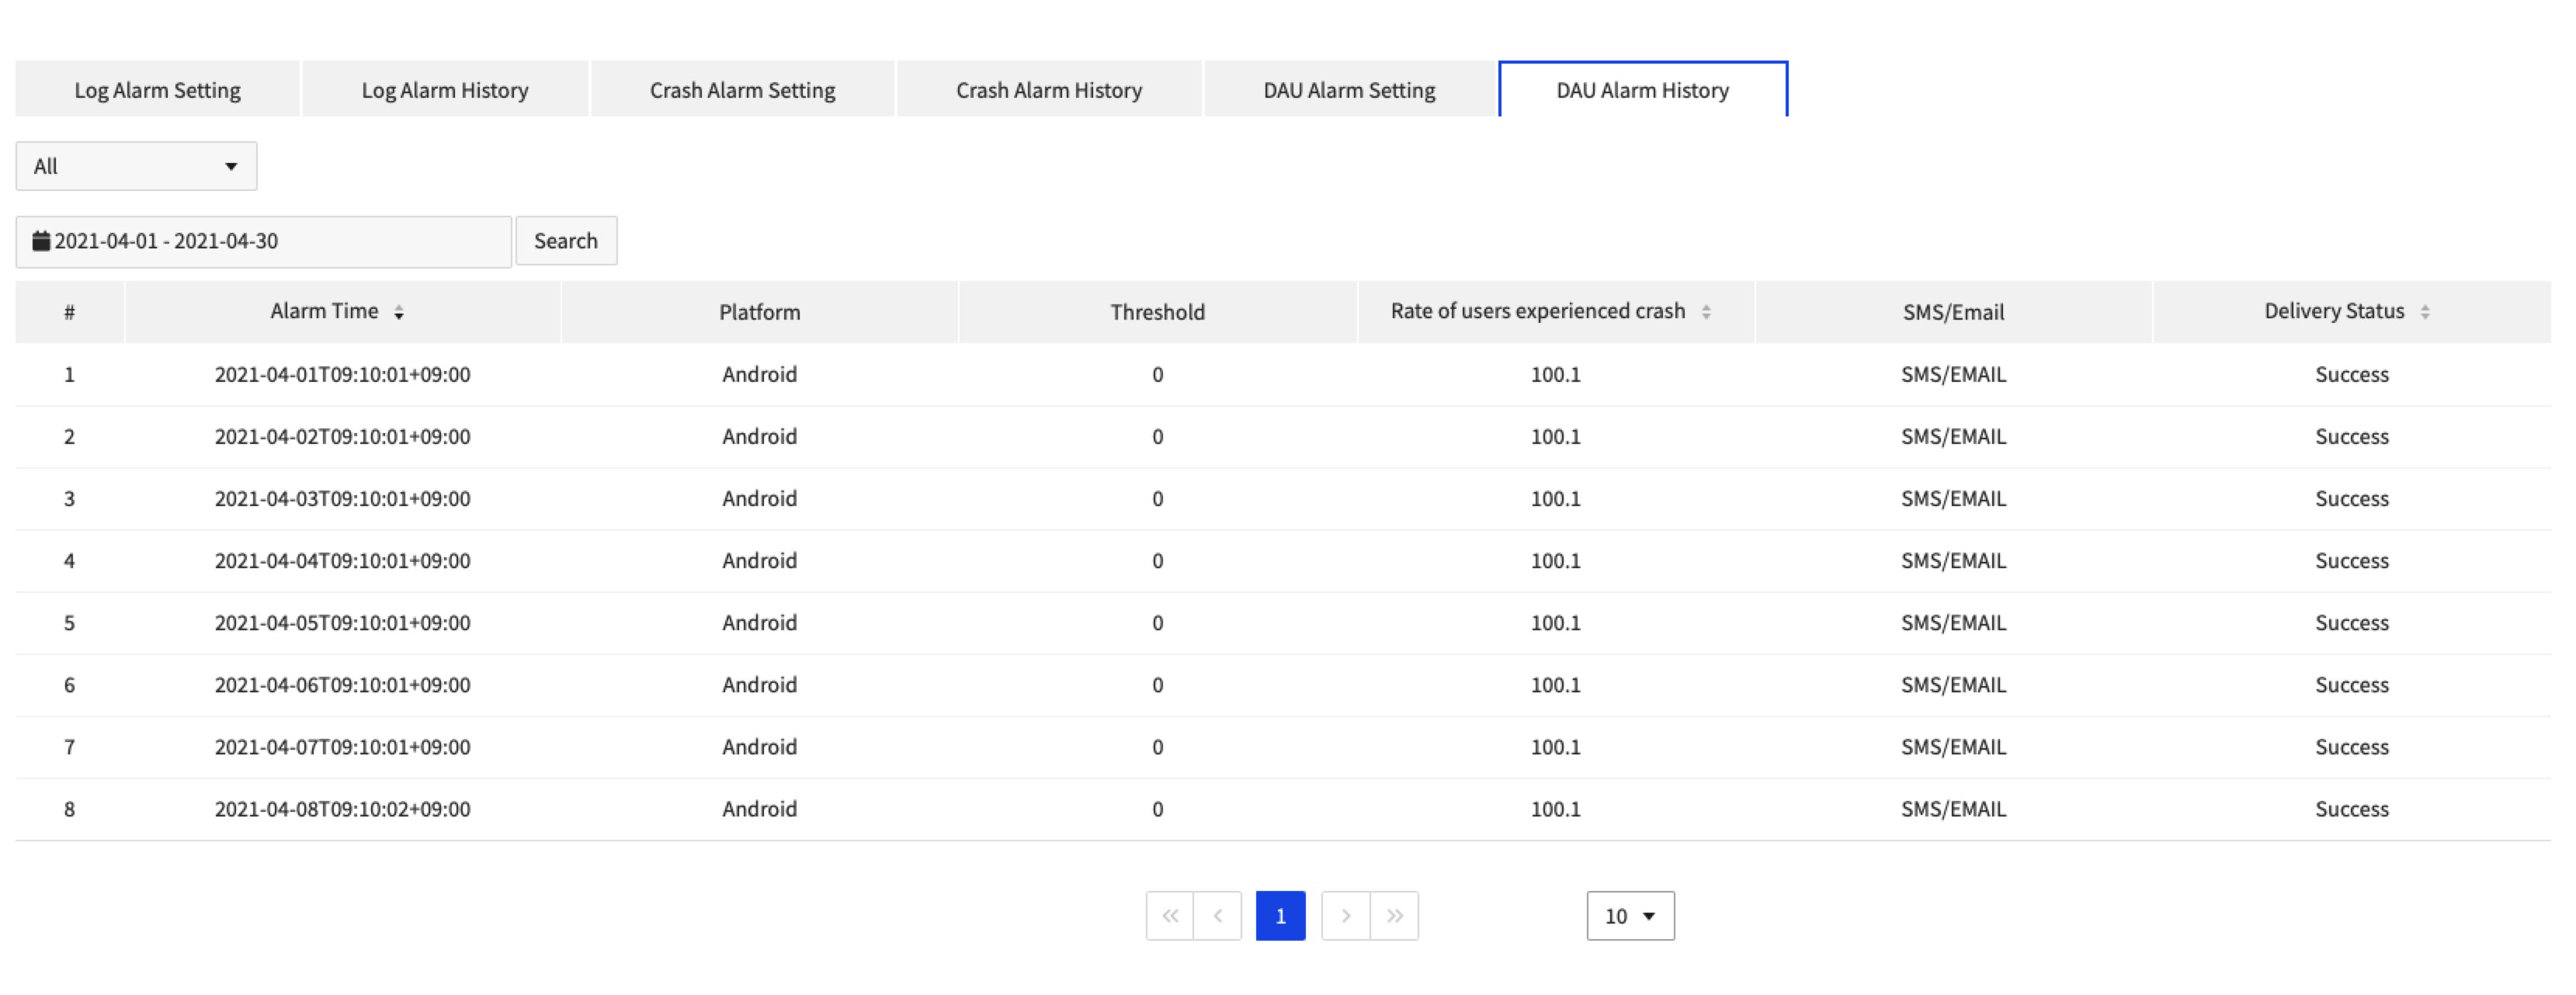
Retrieves the history of user-defined alarm occurrences.
- View by platform
- Set time condition to control viewing range
- Information on alarm time, platform, crash type, threshold, event count, and delivery method/status is provided.
Setting
Manage required service setting, such as search field, issue tracker, and symbol file.
Click Data & Analytics > Log & Crash Search > Setting.
Search Field
Can retrieve search fields for log search: customized fields can be added, to default system fields.
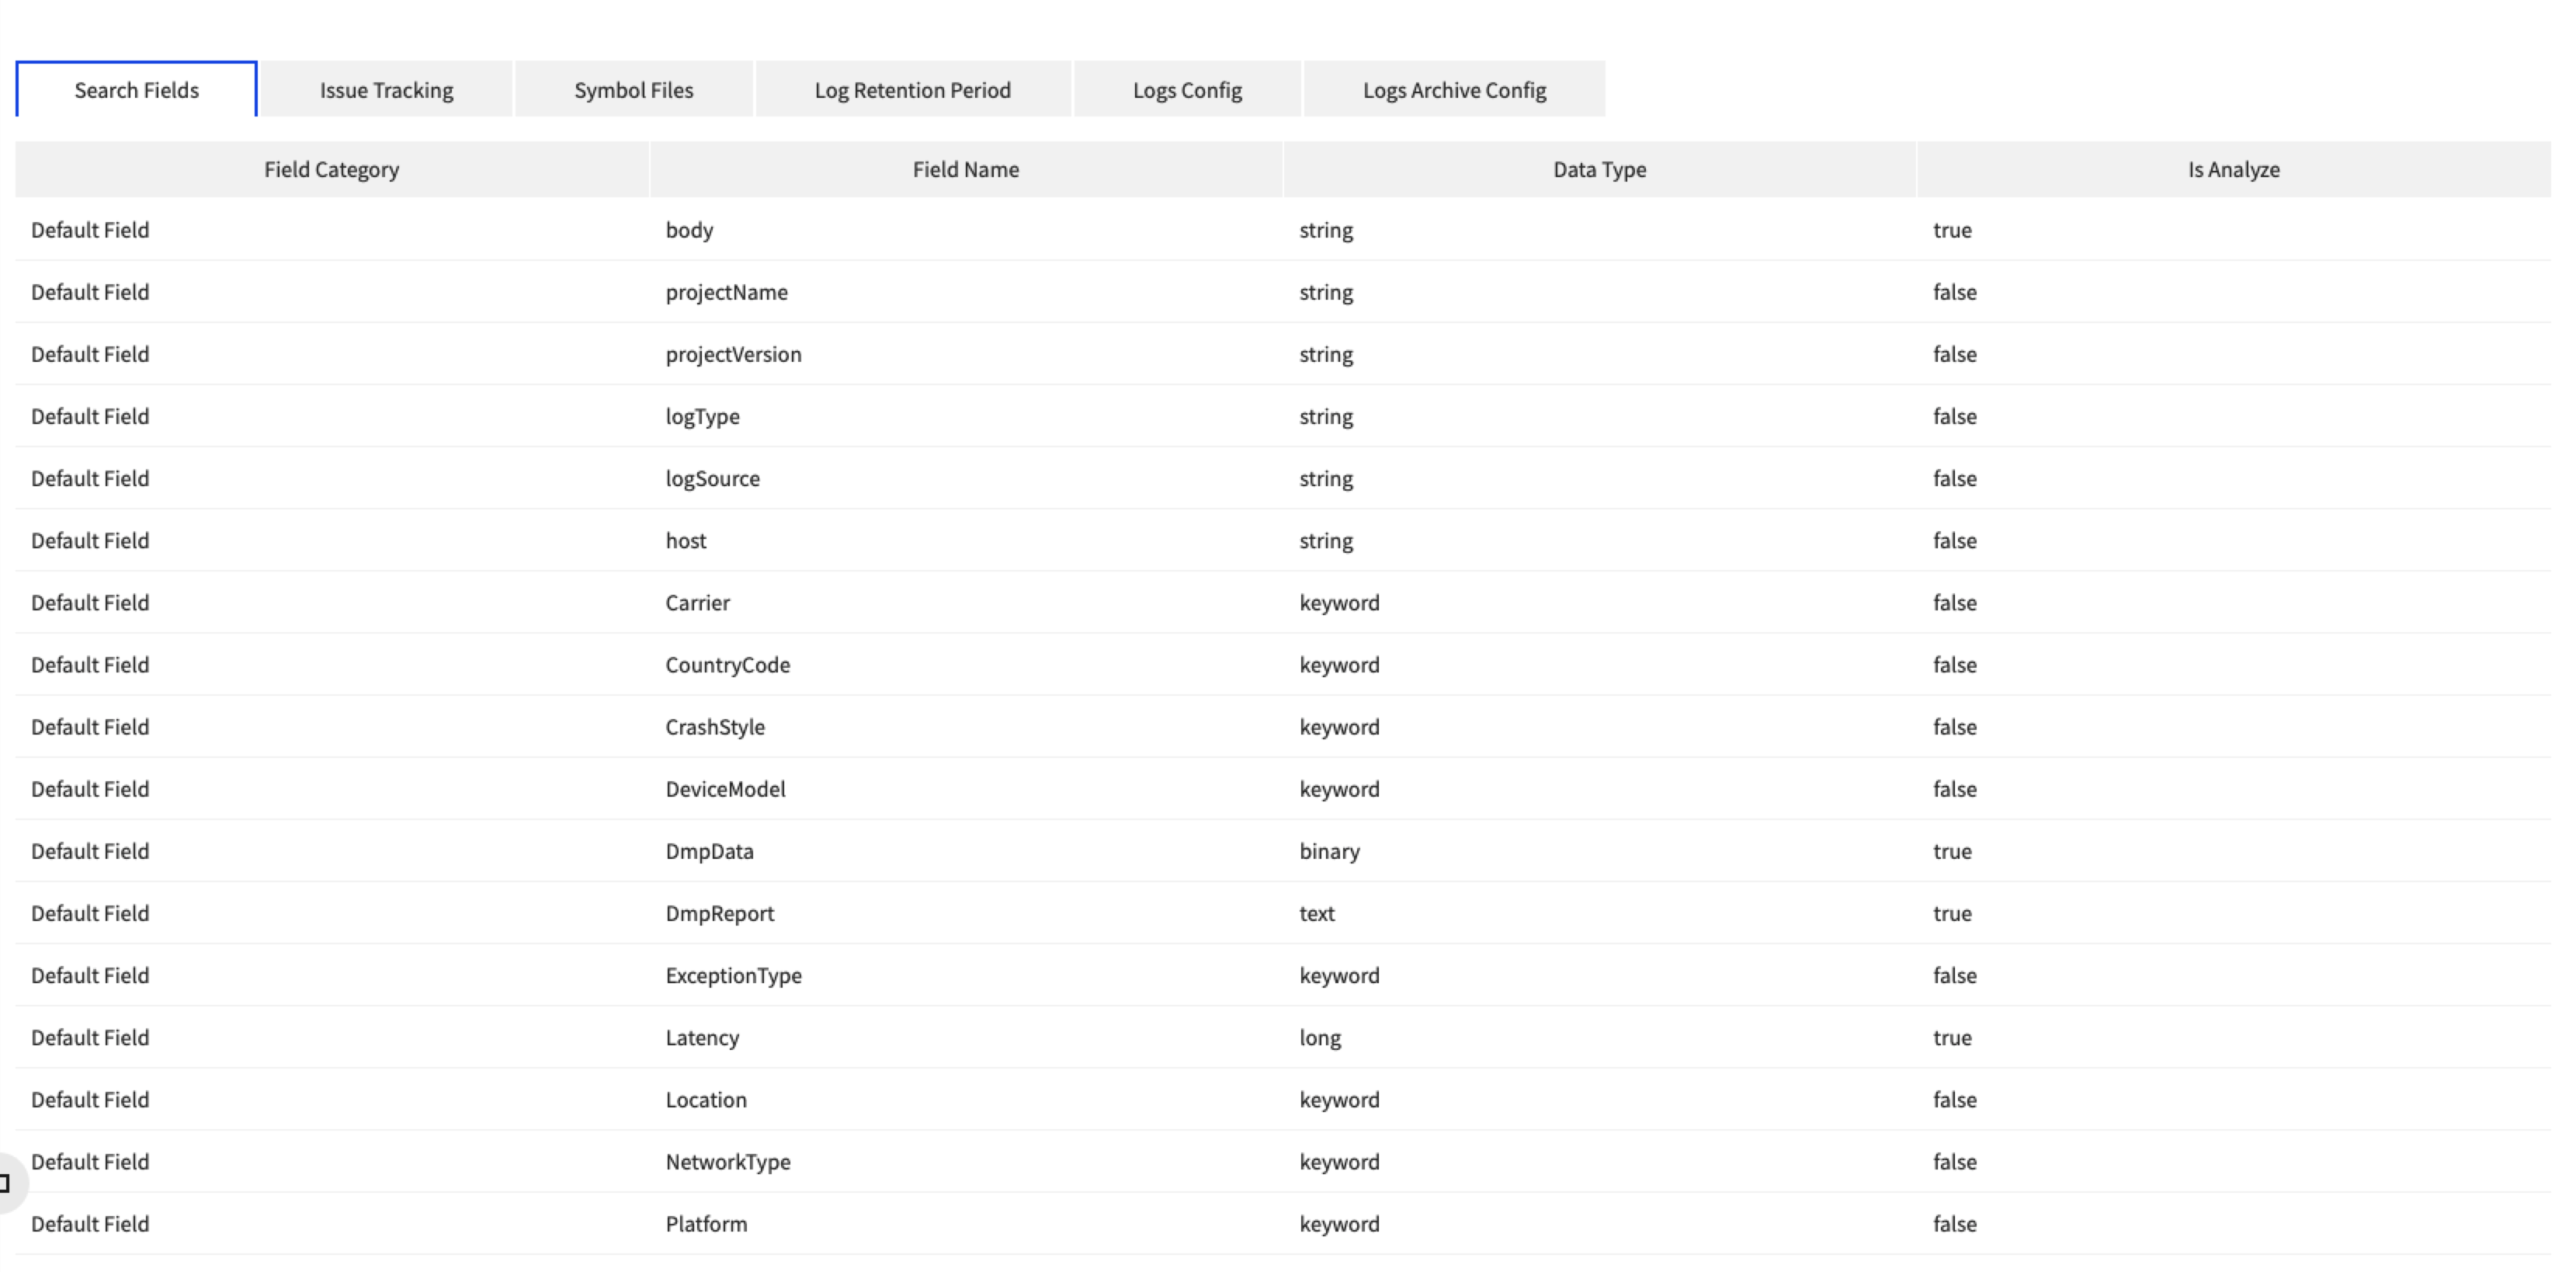
- During log transfer, if a field name starts with txt, whether to analyze or not is set to true. Otherwise, it is set to false. If it is false, it can be registered as a search field of log search.
- If you want to send a log or binary file and use the Download > View link on the Log Search page, include base64-encoded values in the UserBinaryData or UserTxtData field.
Issue Tracking
By setting up an issue tracker, errors can be registered and managed on the Error Detail page with the click of issue list of App Crash Search > Retrieve Issues.
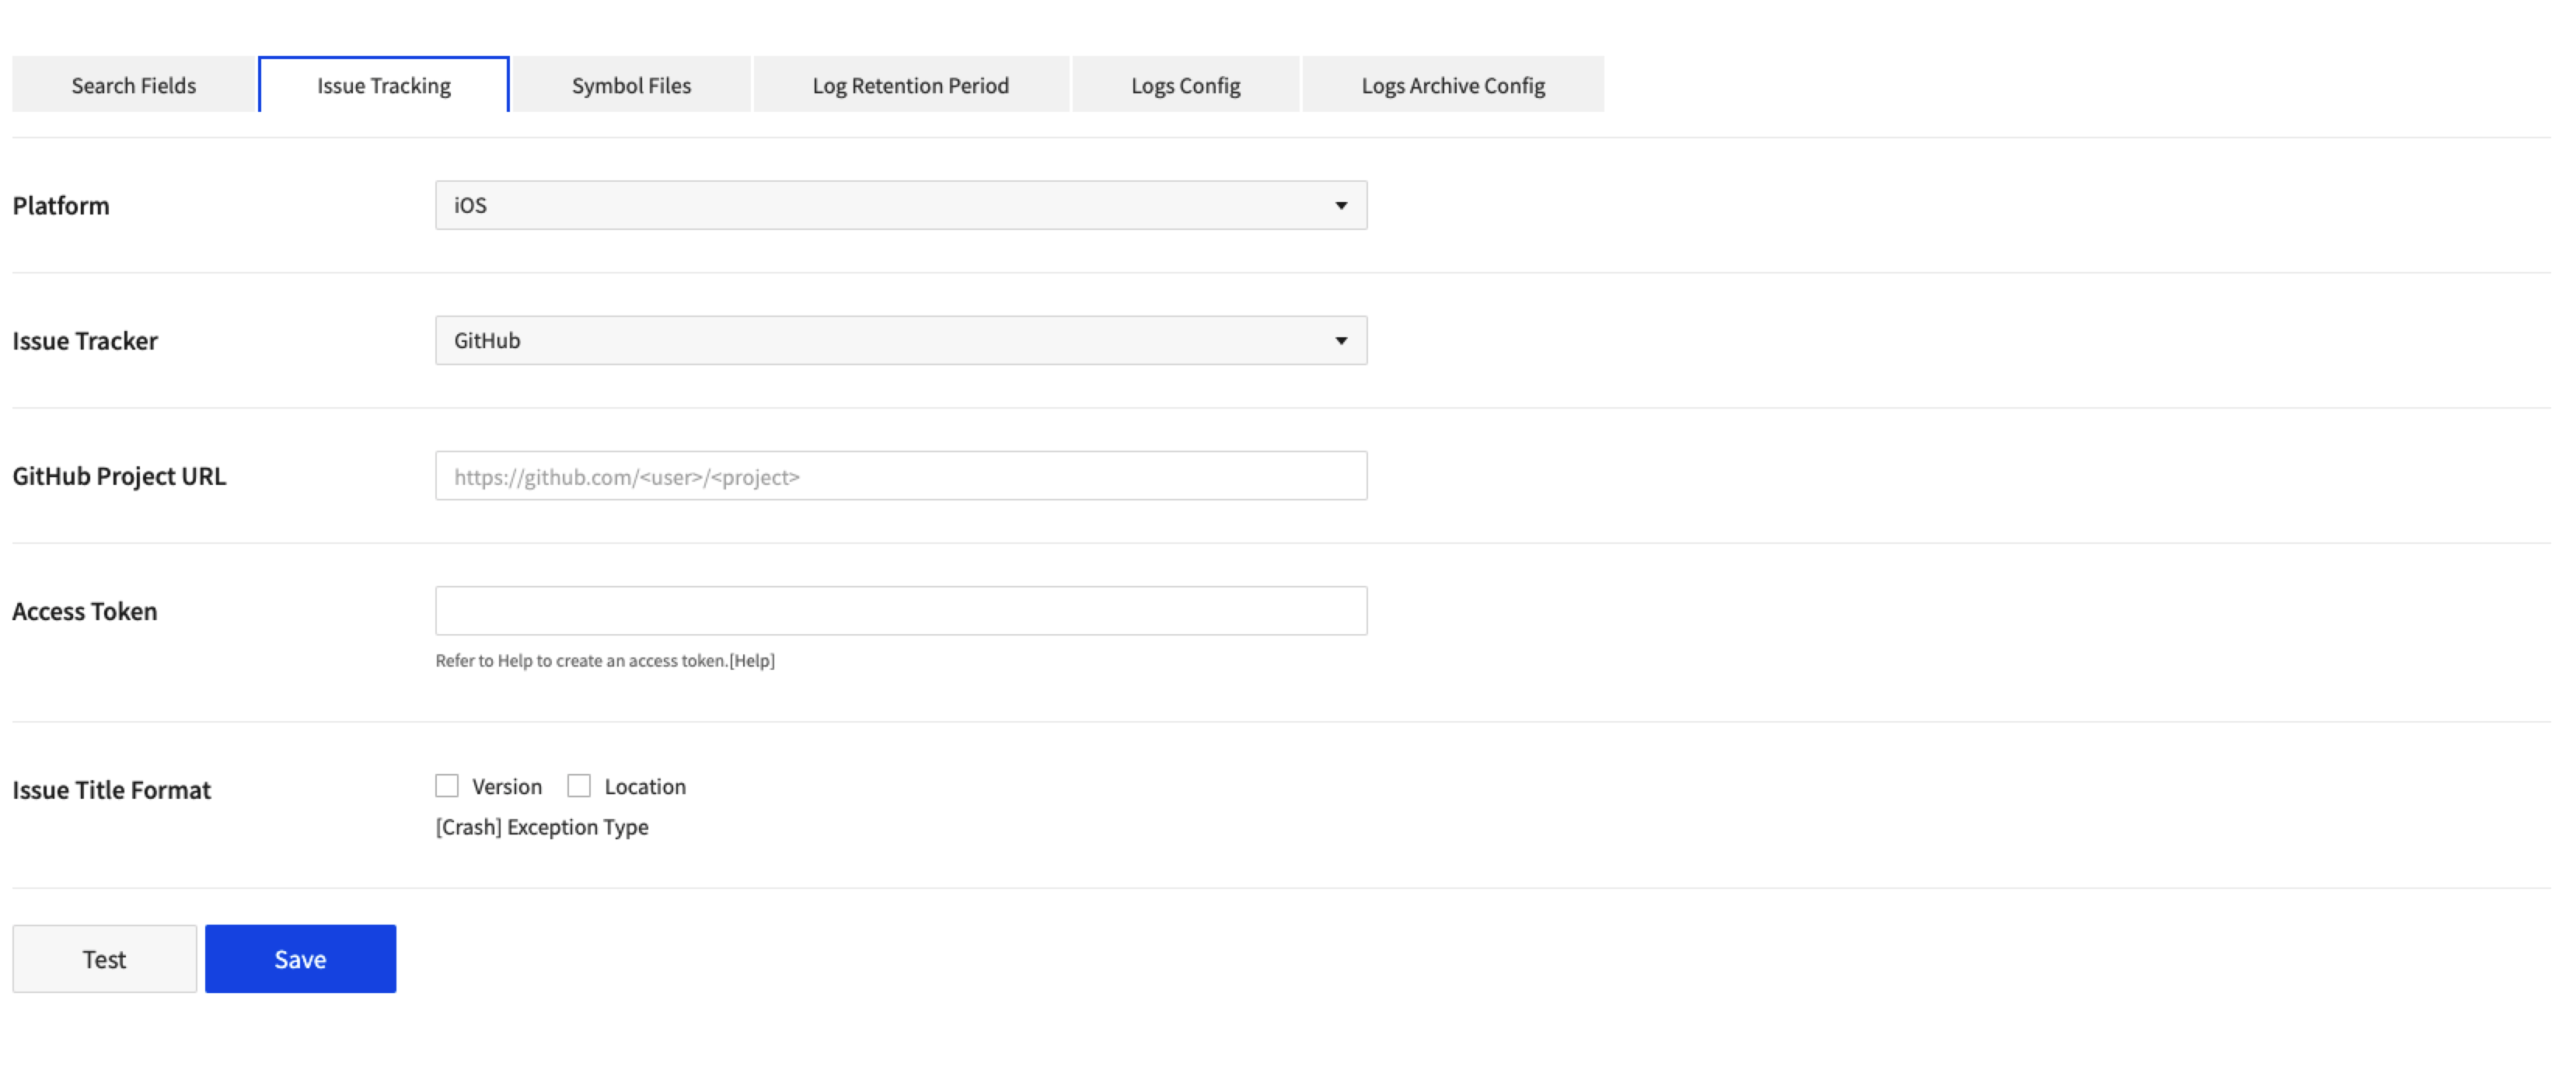
- Platform: Choose a platform among iOS, Android, Windows and WebGL. Can set an issue tracker for each platform.
- Issue Tracker: Choose GitHub or GitLab.
- GitHub Project URL: If GitHub is selected as an issue tracker, enter the URL in the form of https://github.com/{user}/{project}.
- Access Token: If GitHub is selected as an issue tracker, enter an access token created by GitHub (refer to: https://help.github.com/articles/creating-an-access-token-for-command-line-use).
- GitLab Project URL: If GitLb is selected, enter the URL in the form of http://{baseUrl}/{namespace}/{project}.
- Private Token: If GitLab is selected, enter token created at My profile-Account of the GitLab site.
- Issue Title Format: Decide whether to include version and location information to the issue title.
- Test: Check if the setting works fine.
Symbol File
It is required to register a symbol file to check a crash log. This menu helps upload/download/delete symbol files.
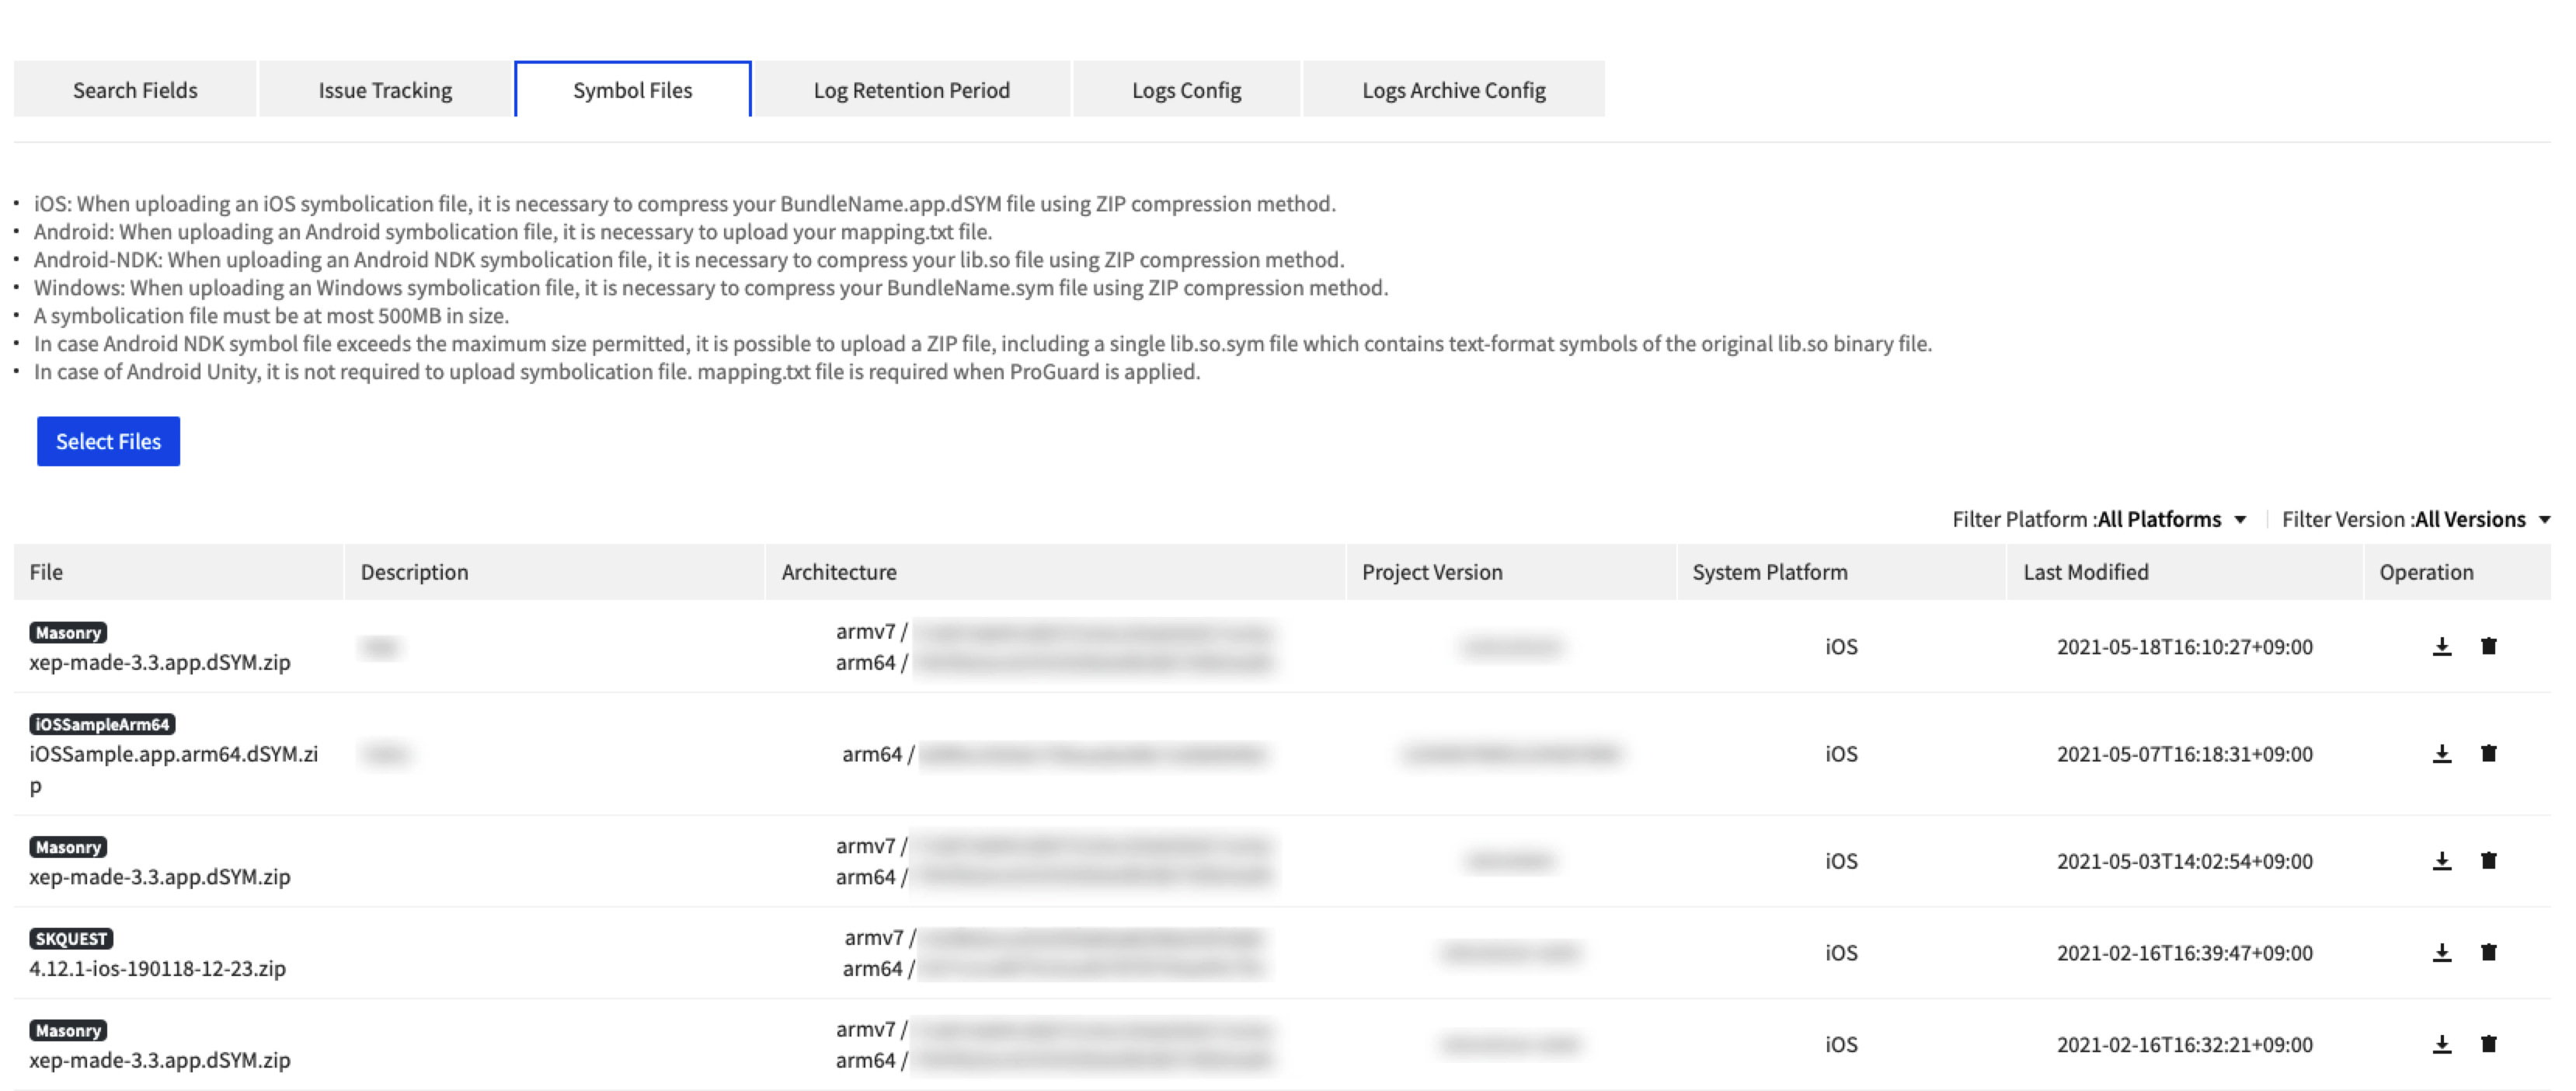
Click [Select Files] to upload a symbol file.
- iOS: When uploading an iOS symbol file, it is necessary to compress your BundleName.app.dSYM file using ZIP compression method.
- Android: When uploading an Android symbol file, it is necessary to upload your mapping.txt file.
- Android-NDK: When uploading an Android NDK symbol file, it is necessary to compress your lib.so file using ZIP compression method.
- Windows: When uploading a Windows symbol file, it is necessary to compress your BundleName.sym file using - ZIP compression method. A symbol file must be at most 200MB in size.
- In case of Android NDK, when a symbol file size exceeds the maximum size permitted, it is possible to upload a ZIP file which contains a single ‘lib.so.sym’ file that contains the text-format symbols of the original ‘lib.so’ binary file.
- In case of Android Unity, registration of a symbol file is not required. However, when ProGuard is applied, it is necessary to upload your mapping.txt file.
Log Retention Period
Set the period of log retention.
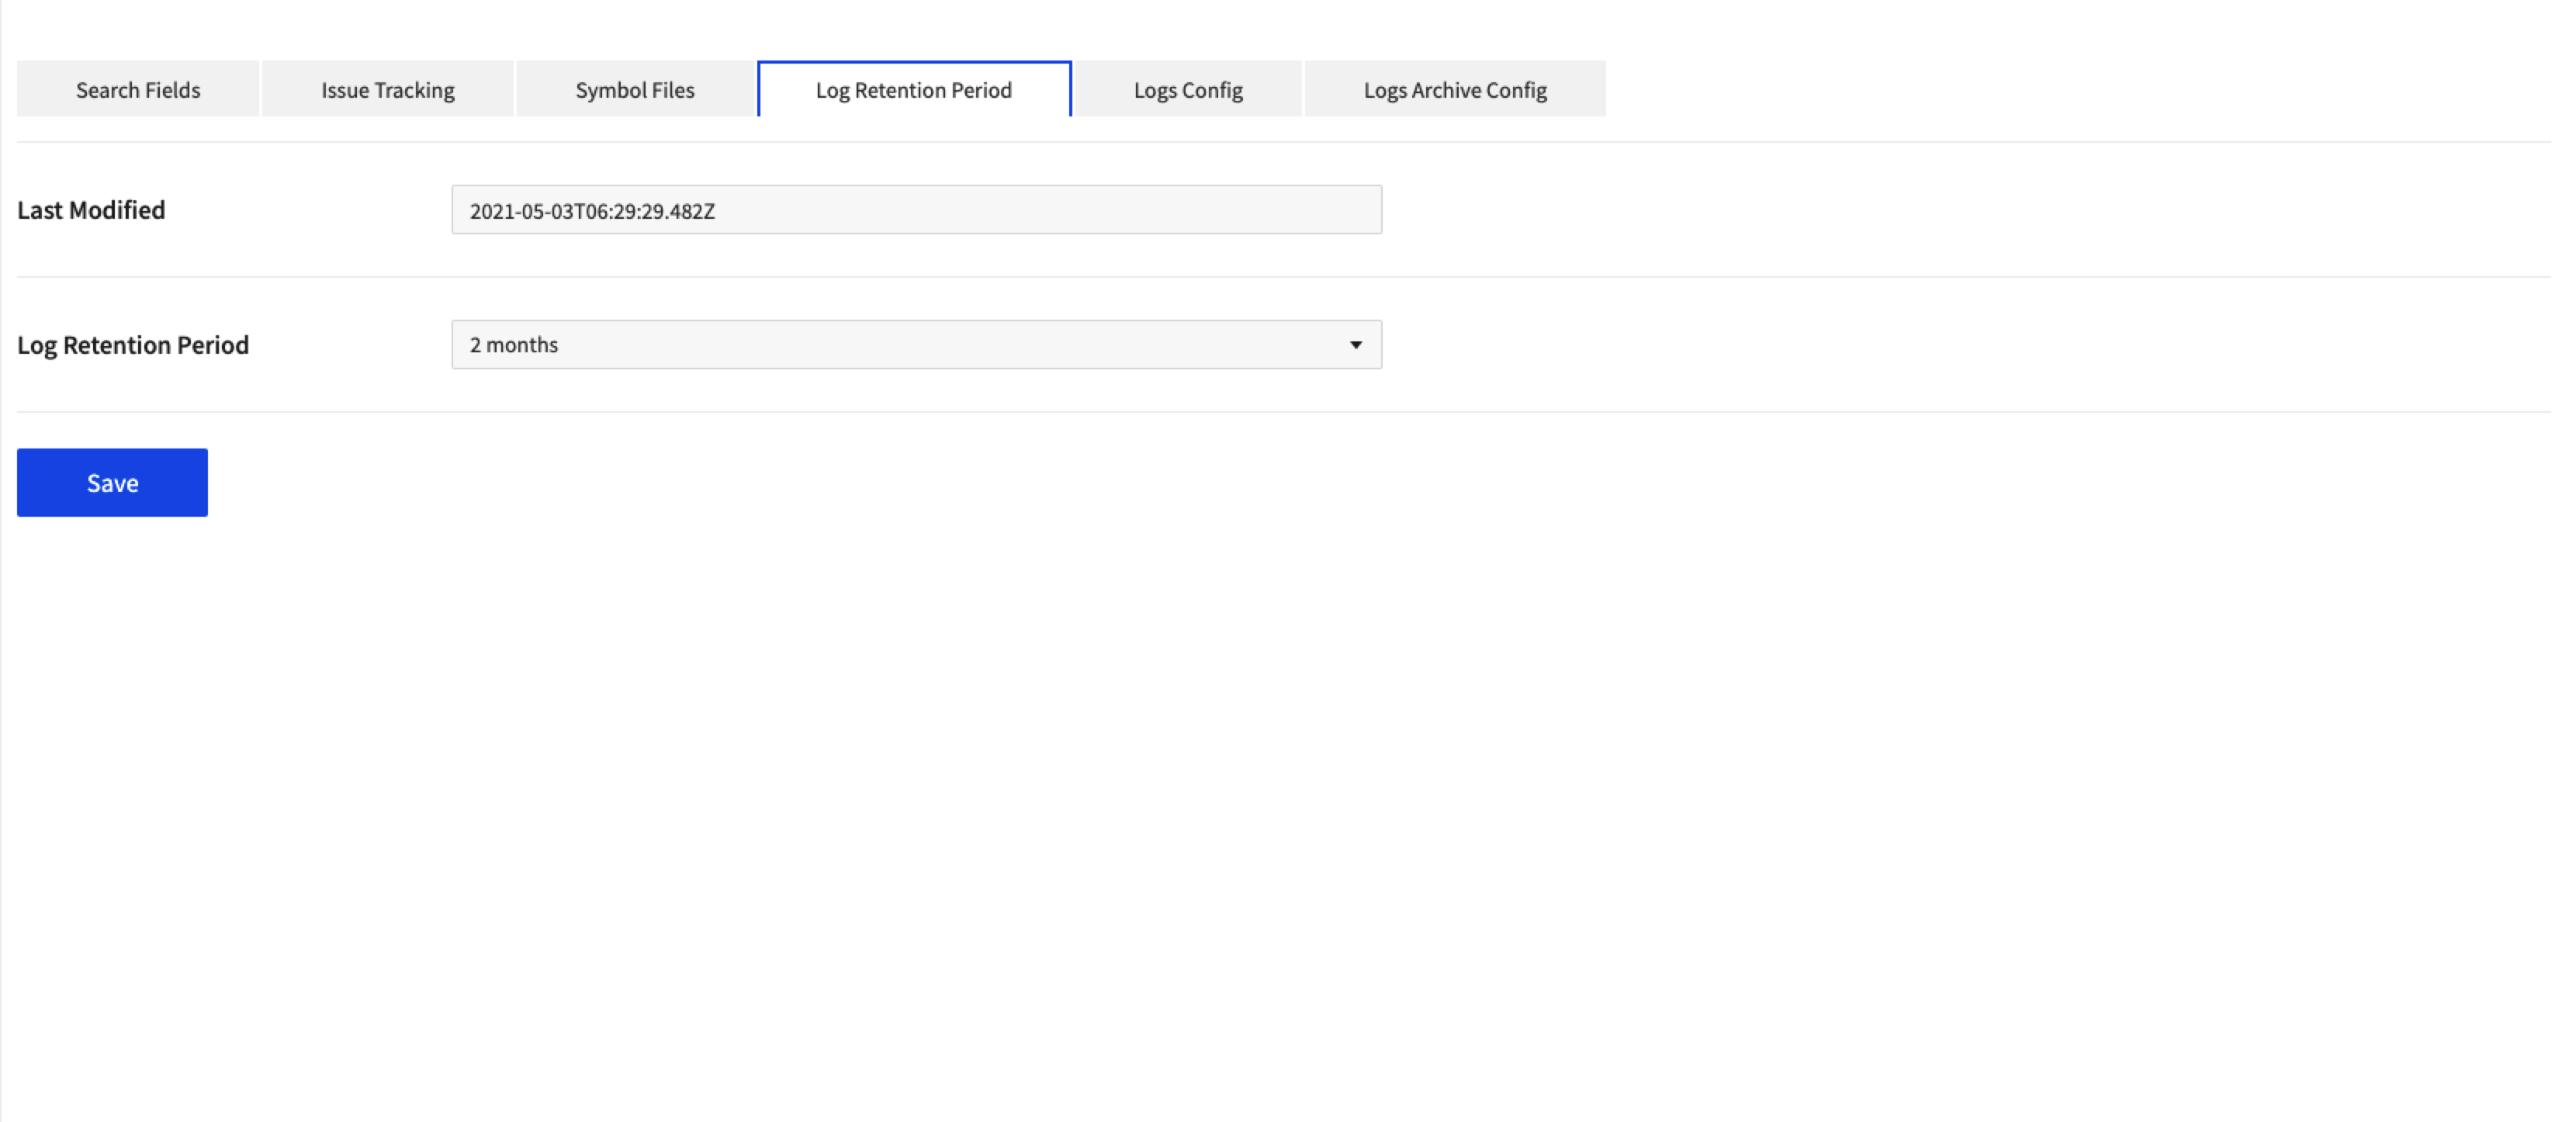
- To change the log retention period, please contact Customer Center.
- Changes to the log retention period are applied at 00:00 on the 1st of the following month, and charges are incurred according to the retention period.
Log Transfer Configuration
Set whether to send logs for each service.
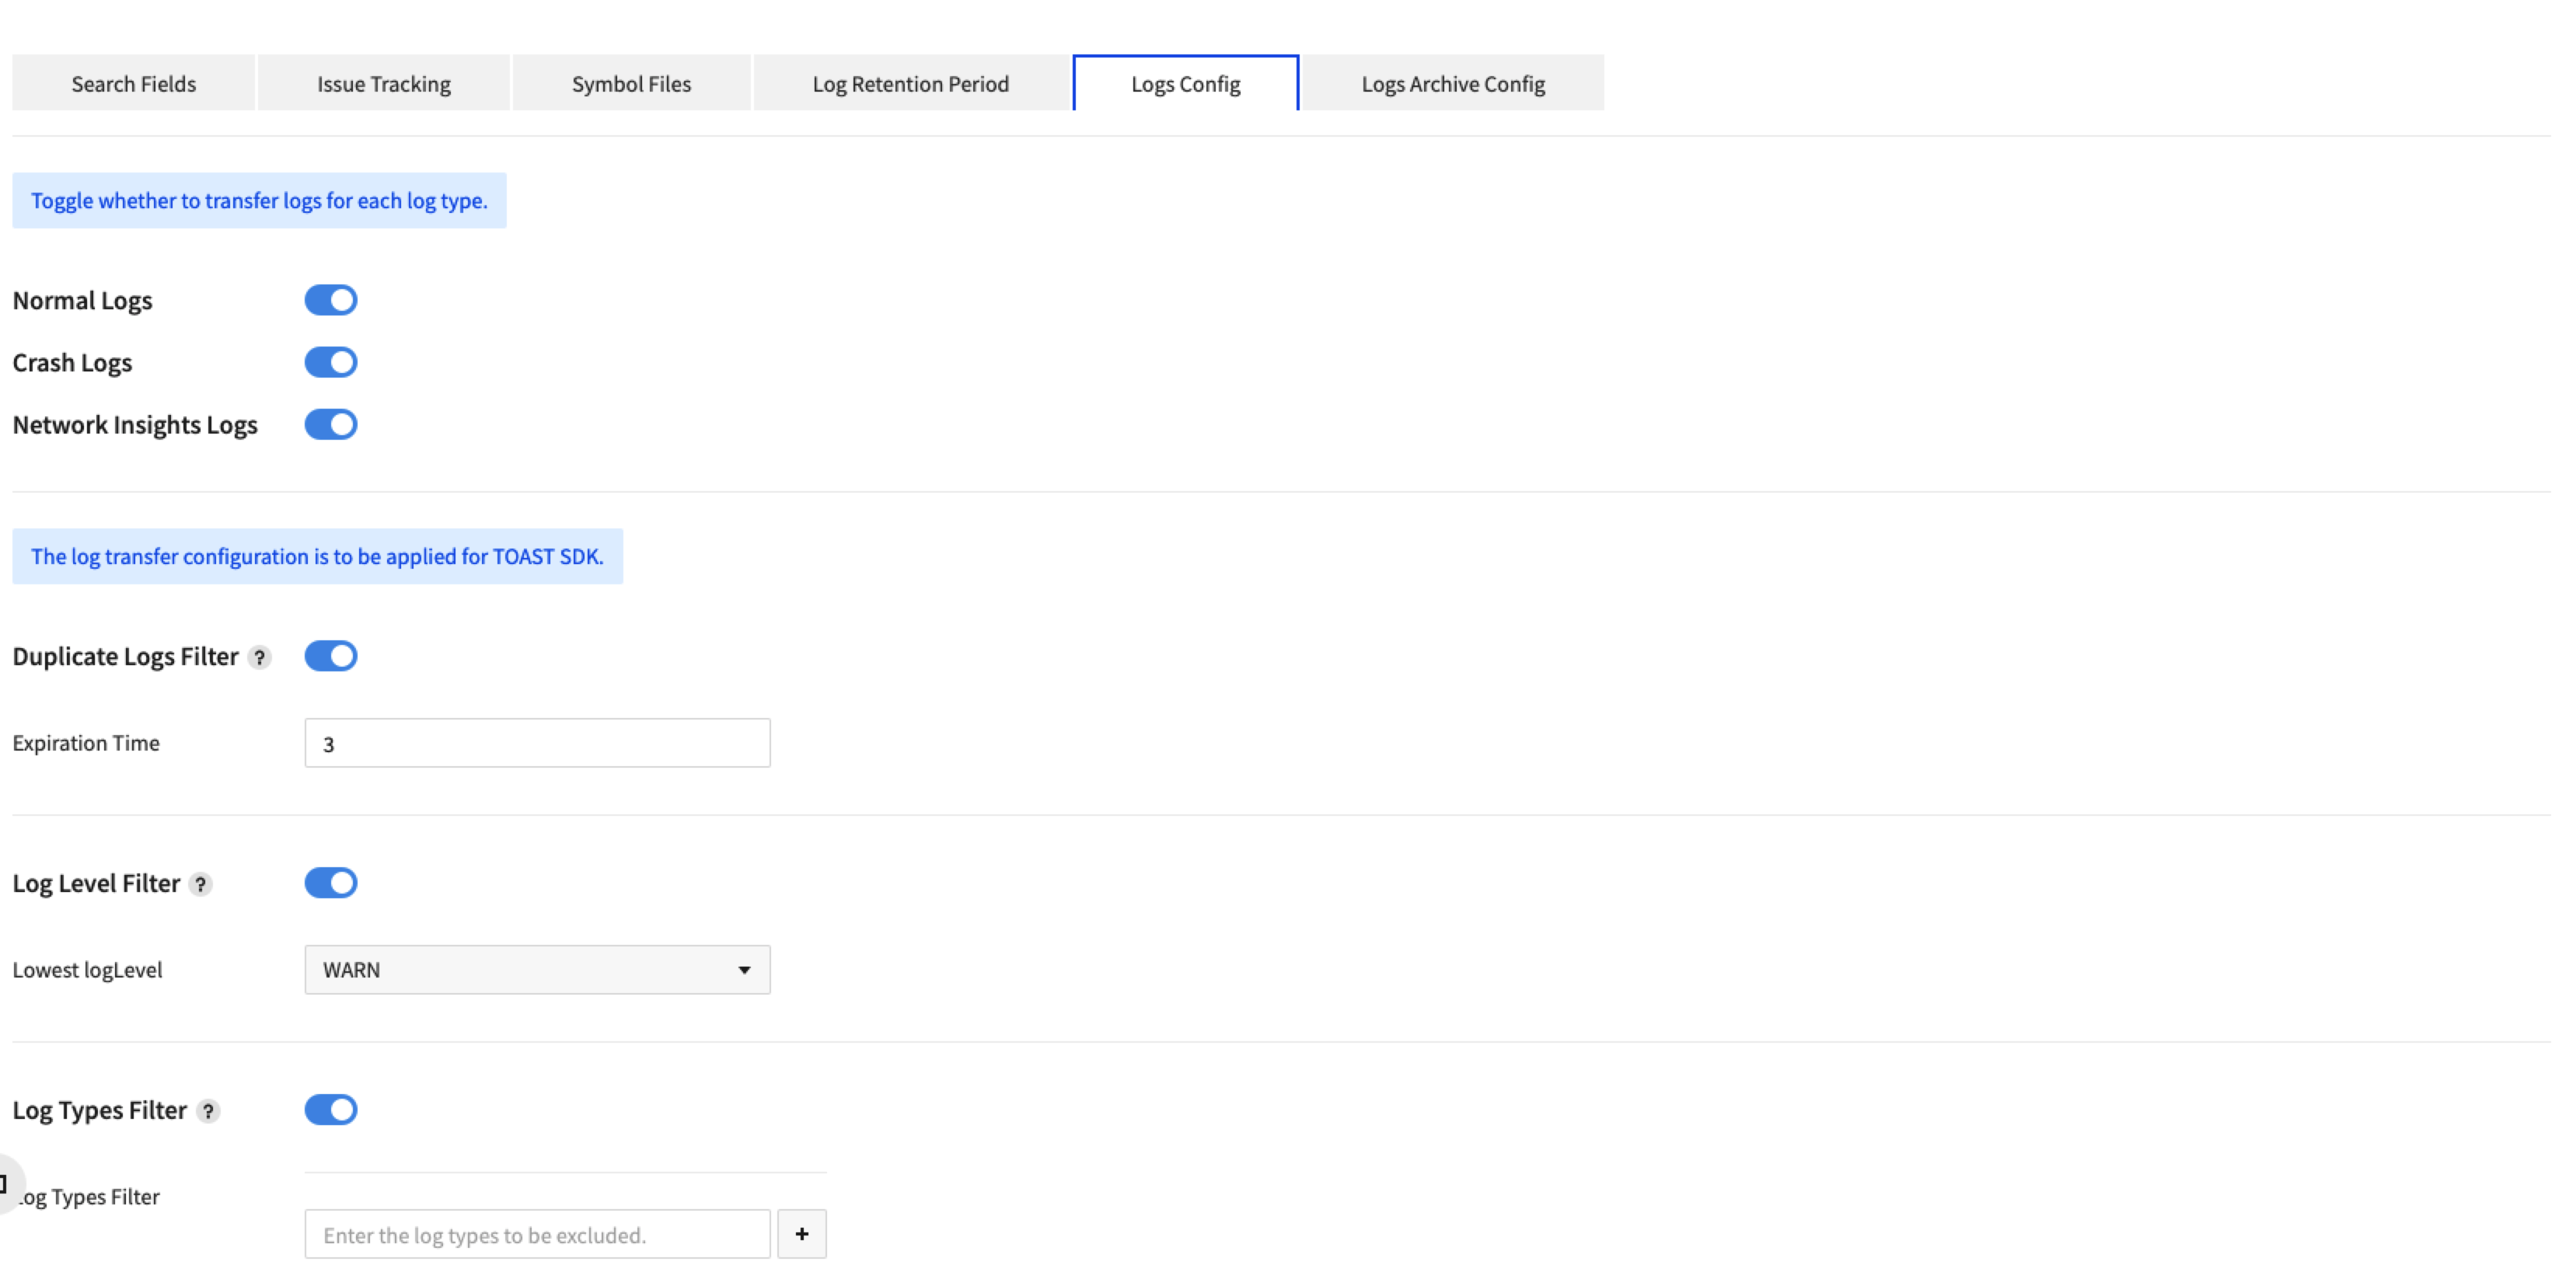
- You can set whether to send logs for general logs, crash logs, and Network Insights logs, respectively.
- You can set whether or not to send logs for TOAST SDK.
- You can filter by duplicate log, log level, and log type.
- After saving the settings, restart the app to apply the setting.
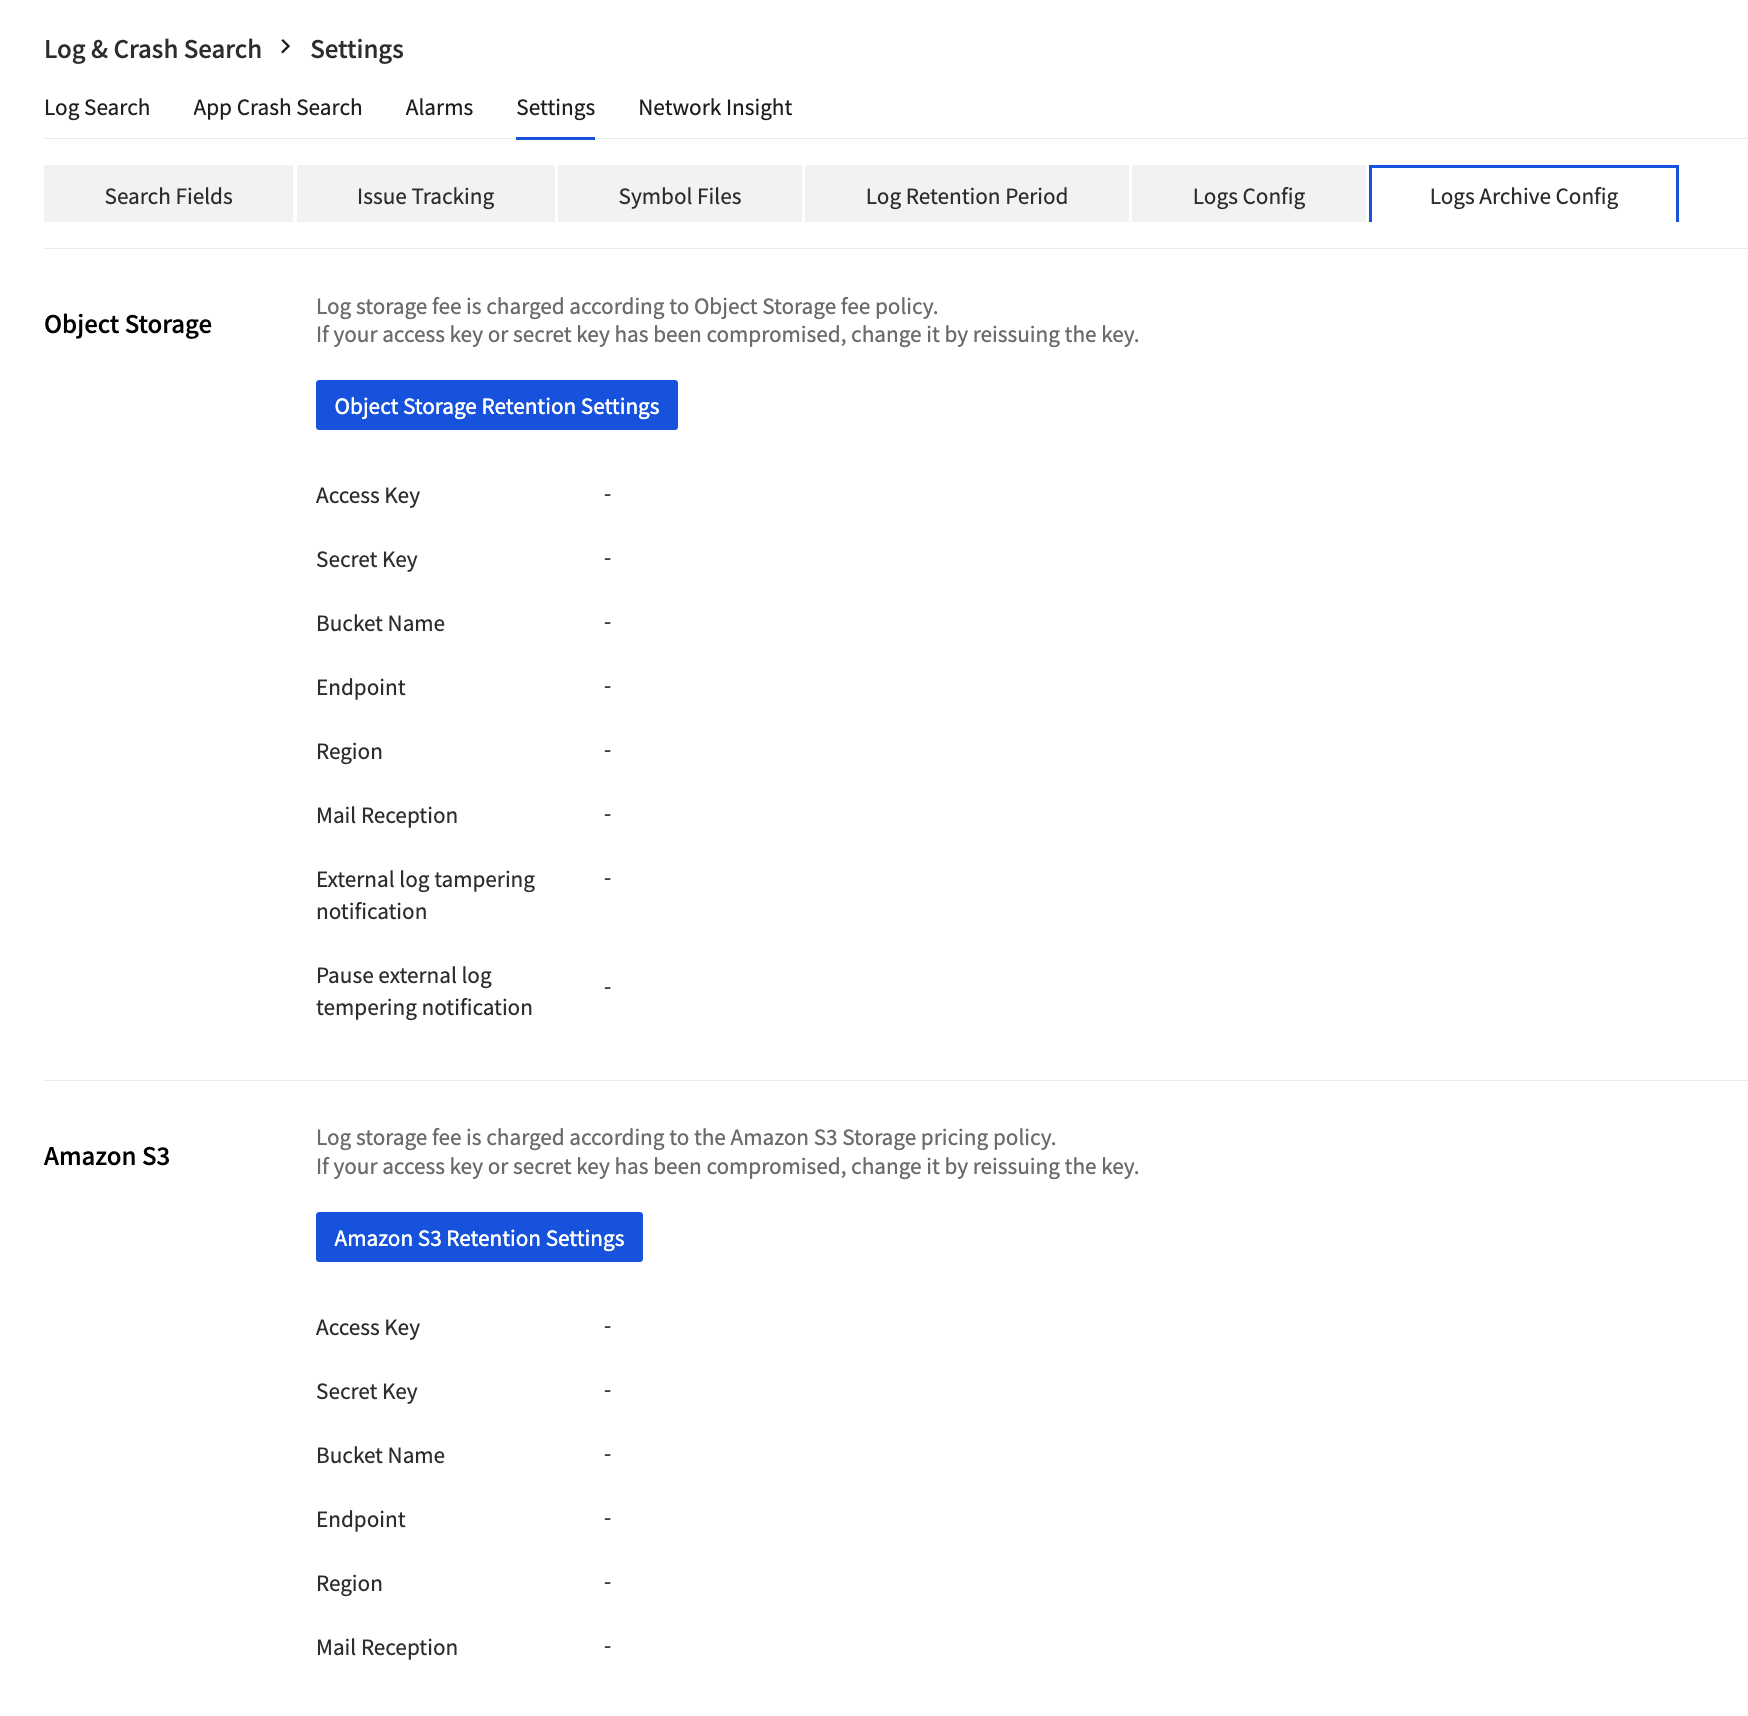
External Log Storage Setting
Set information for external log storage.
-
Logs can be stored at an external OBS.
-
Visit AWS S3 API and register/query credential to import access key and secret key.
- From the External Log Storage Settings, click Storage Settings.
- Enter data, including access key and secret key.
- All of the information about external log tampering notifications is required when adding/editing/deleting settings.
-
After all data entered for OBS, click Save.
- A temporary file is created in the bucket you set up for integration verification.
-
Logs are saved at OBS as configured.
- Guide for NHN Cloud OBS API
Network Insights
Show latency and error rate delivered by Log & Crash Search SDK, on a timeline chart, URL list, or map.
Click Data & Analytics > Log & Crash Search > Network Insights.
- SDK delivers latency and status of a client request from screen of URL setting to URL, to Log & Crash Search
- Set current platform and filter on the screen of monitoring and index, and check latency and error rate.
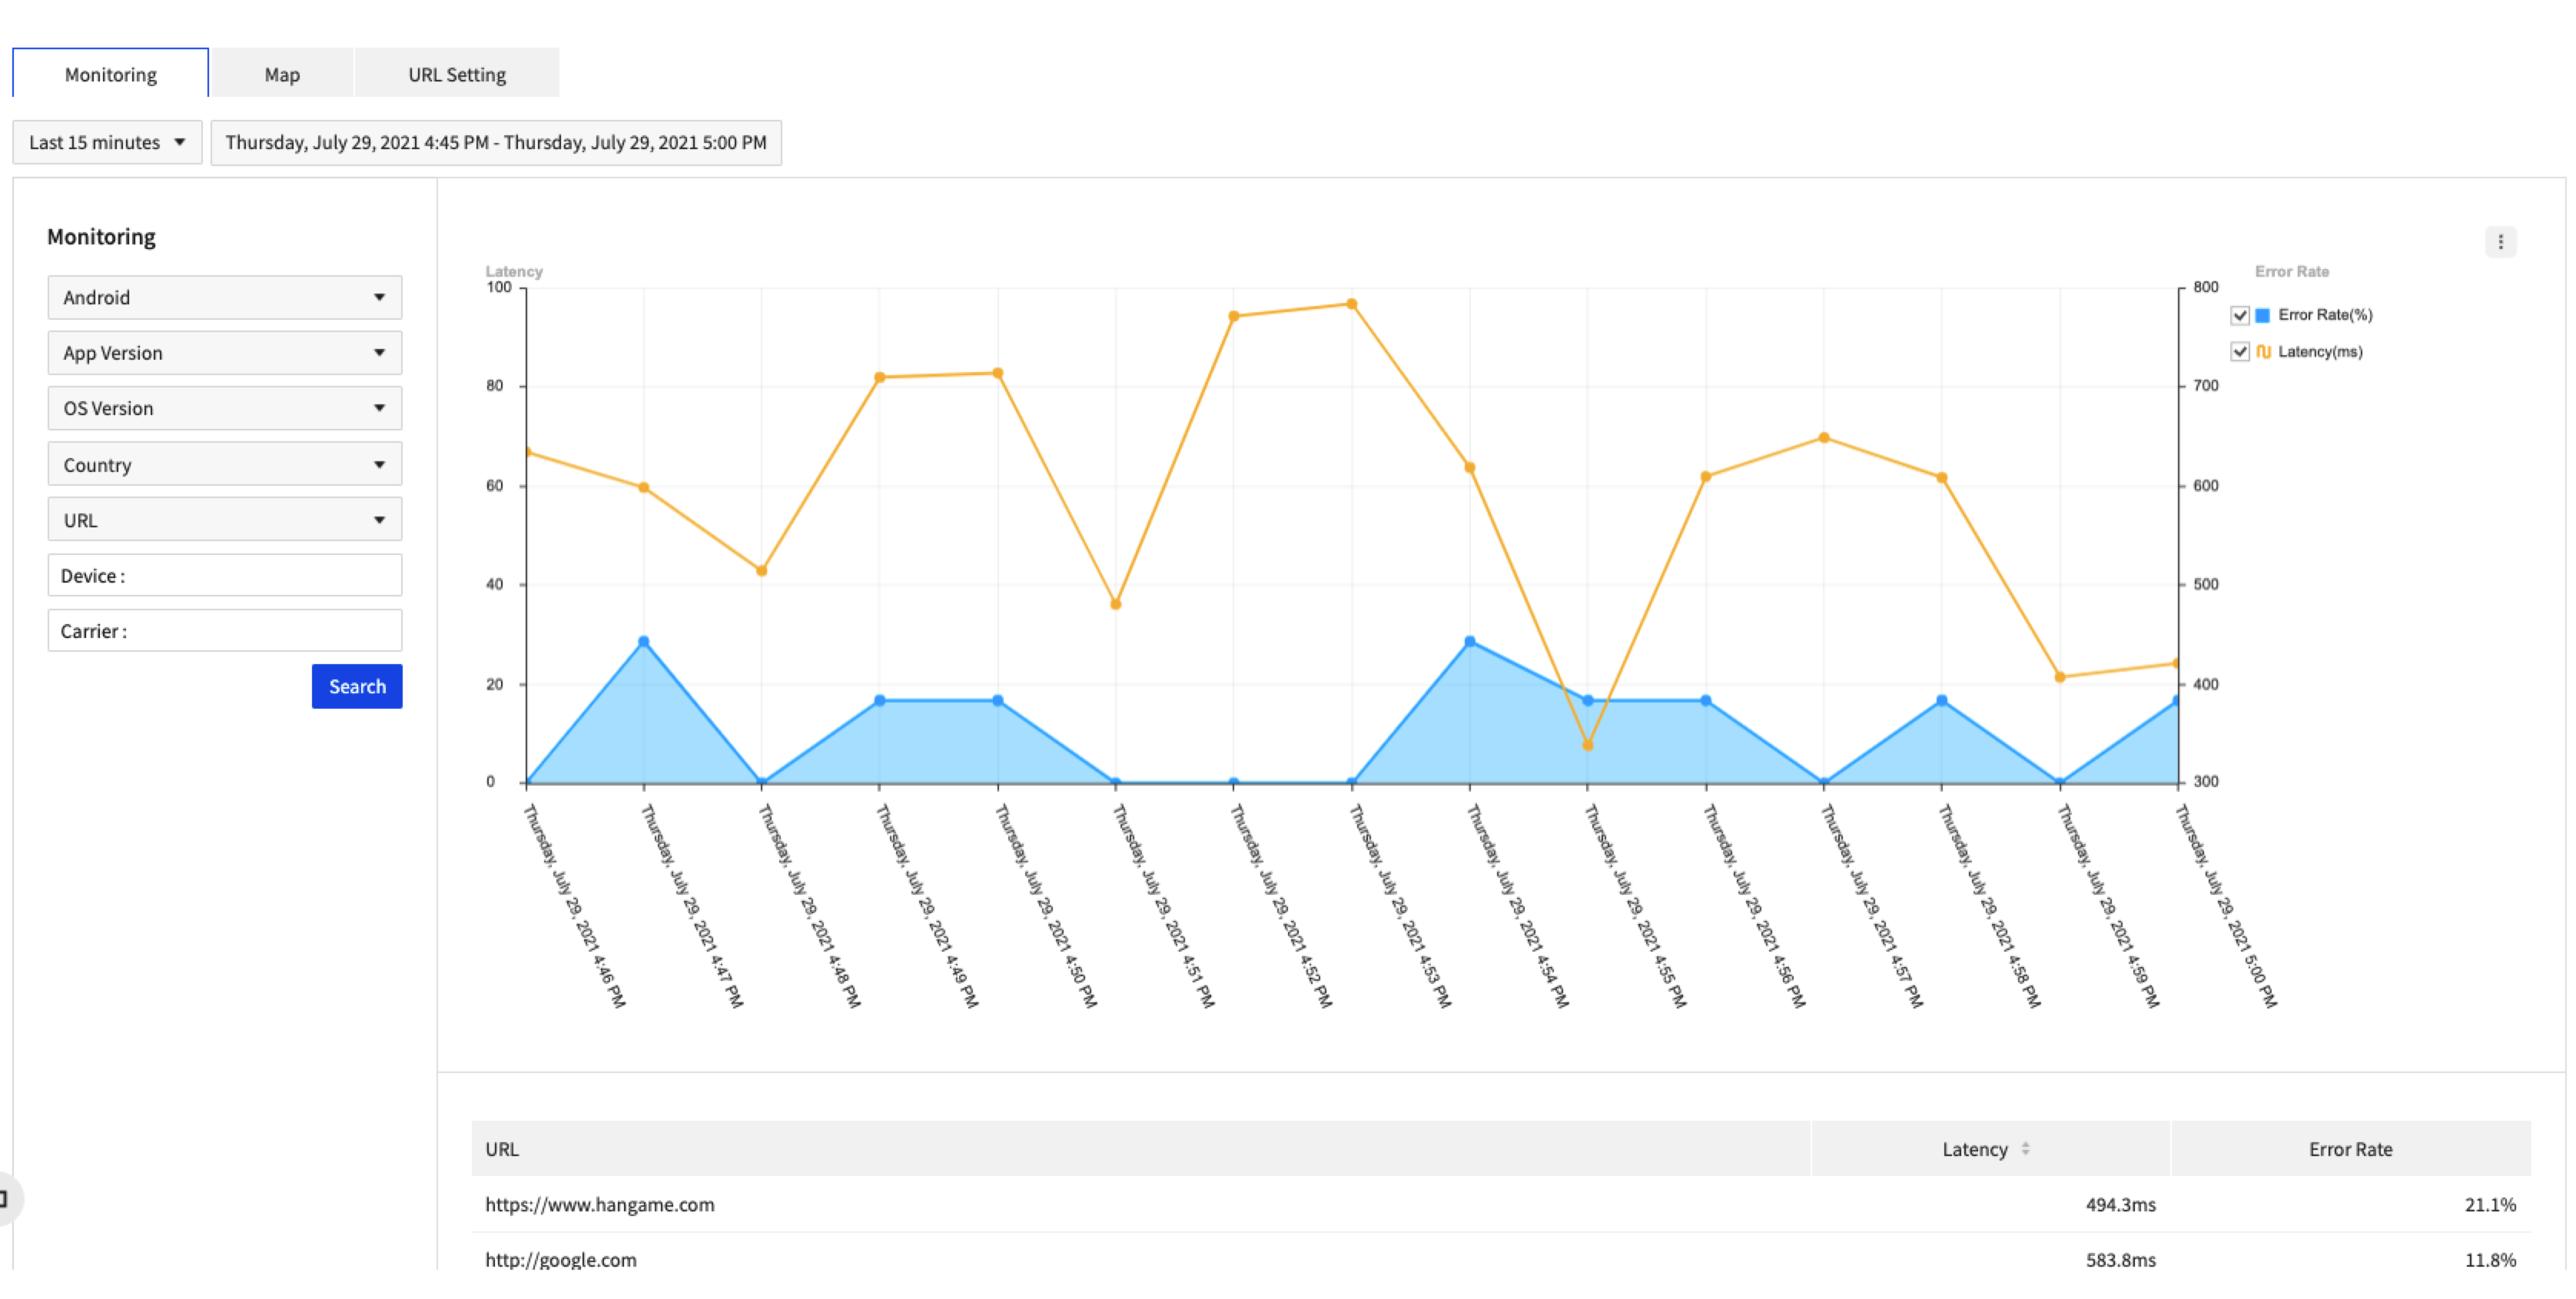
Monitoring
- Display latency and error rate on a timeline chart and URL list.
| Item | Description |
|---|---|
| Filter Conditions | - Recent: Retrieving filter of each time, such as recent 15 minutes, 60 minutes, 24 hours, or 48 hours. For user-defined conditions, retrieve by selecting start/end dates (up to 48 hours). - App Version: Retrieving filter per app version - OS Version: Retrieving filter per OS version - Device: Enter device name - Telecom: Enter telecom name - Country: Filter by countries - URL: Filter by URLs |
| Chart | Latency and error rate is shown on timeline graph. You can select iOS, Android, Windows, or WebGL from Current Platform dropdown menu. |
| URL | Latency and error rate per URL is shown in the table. |
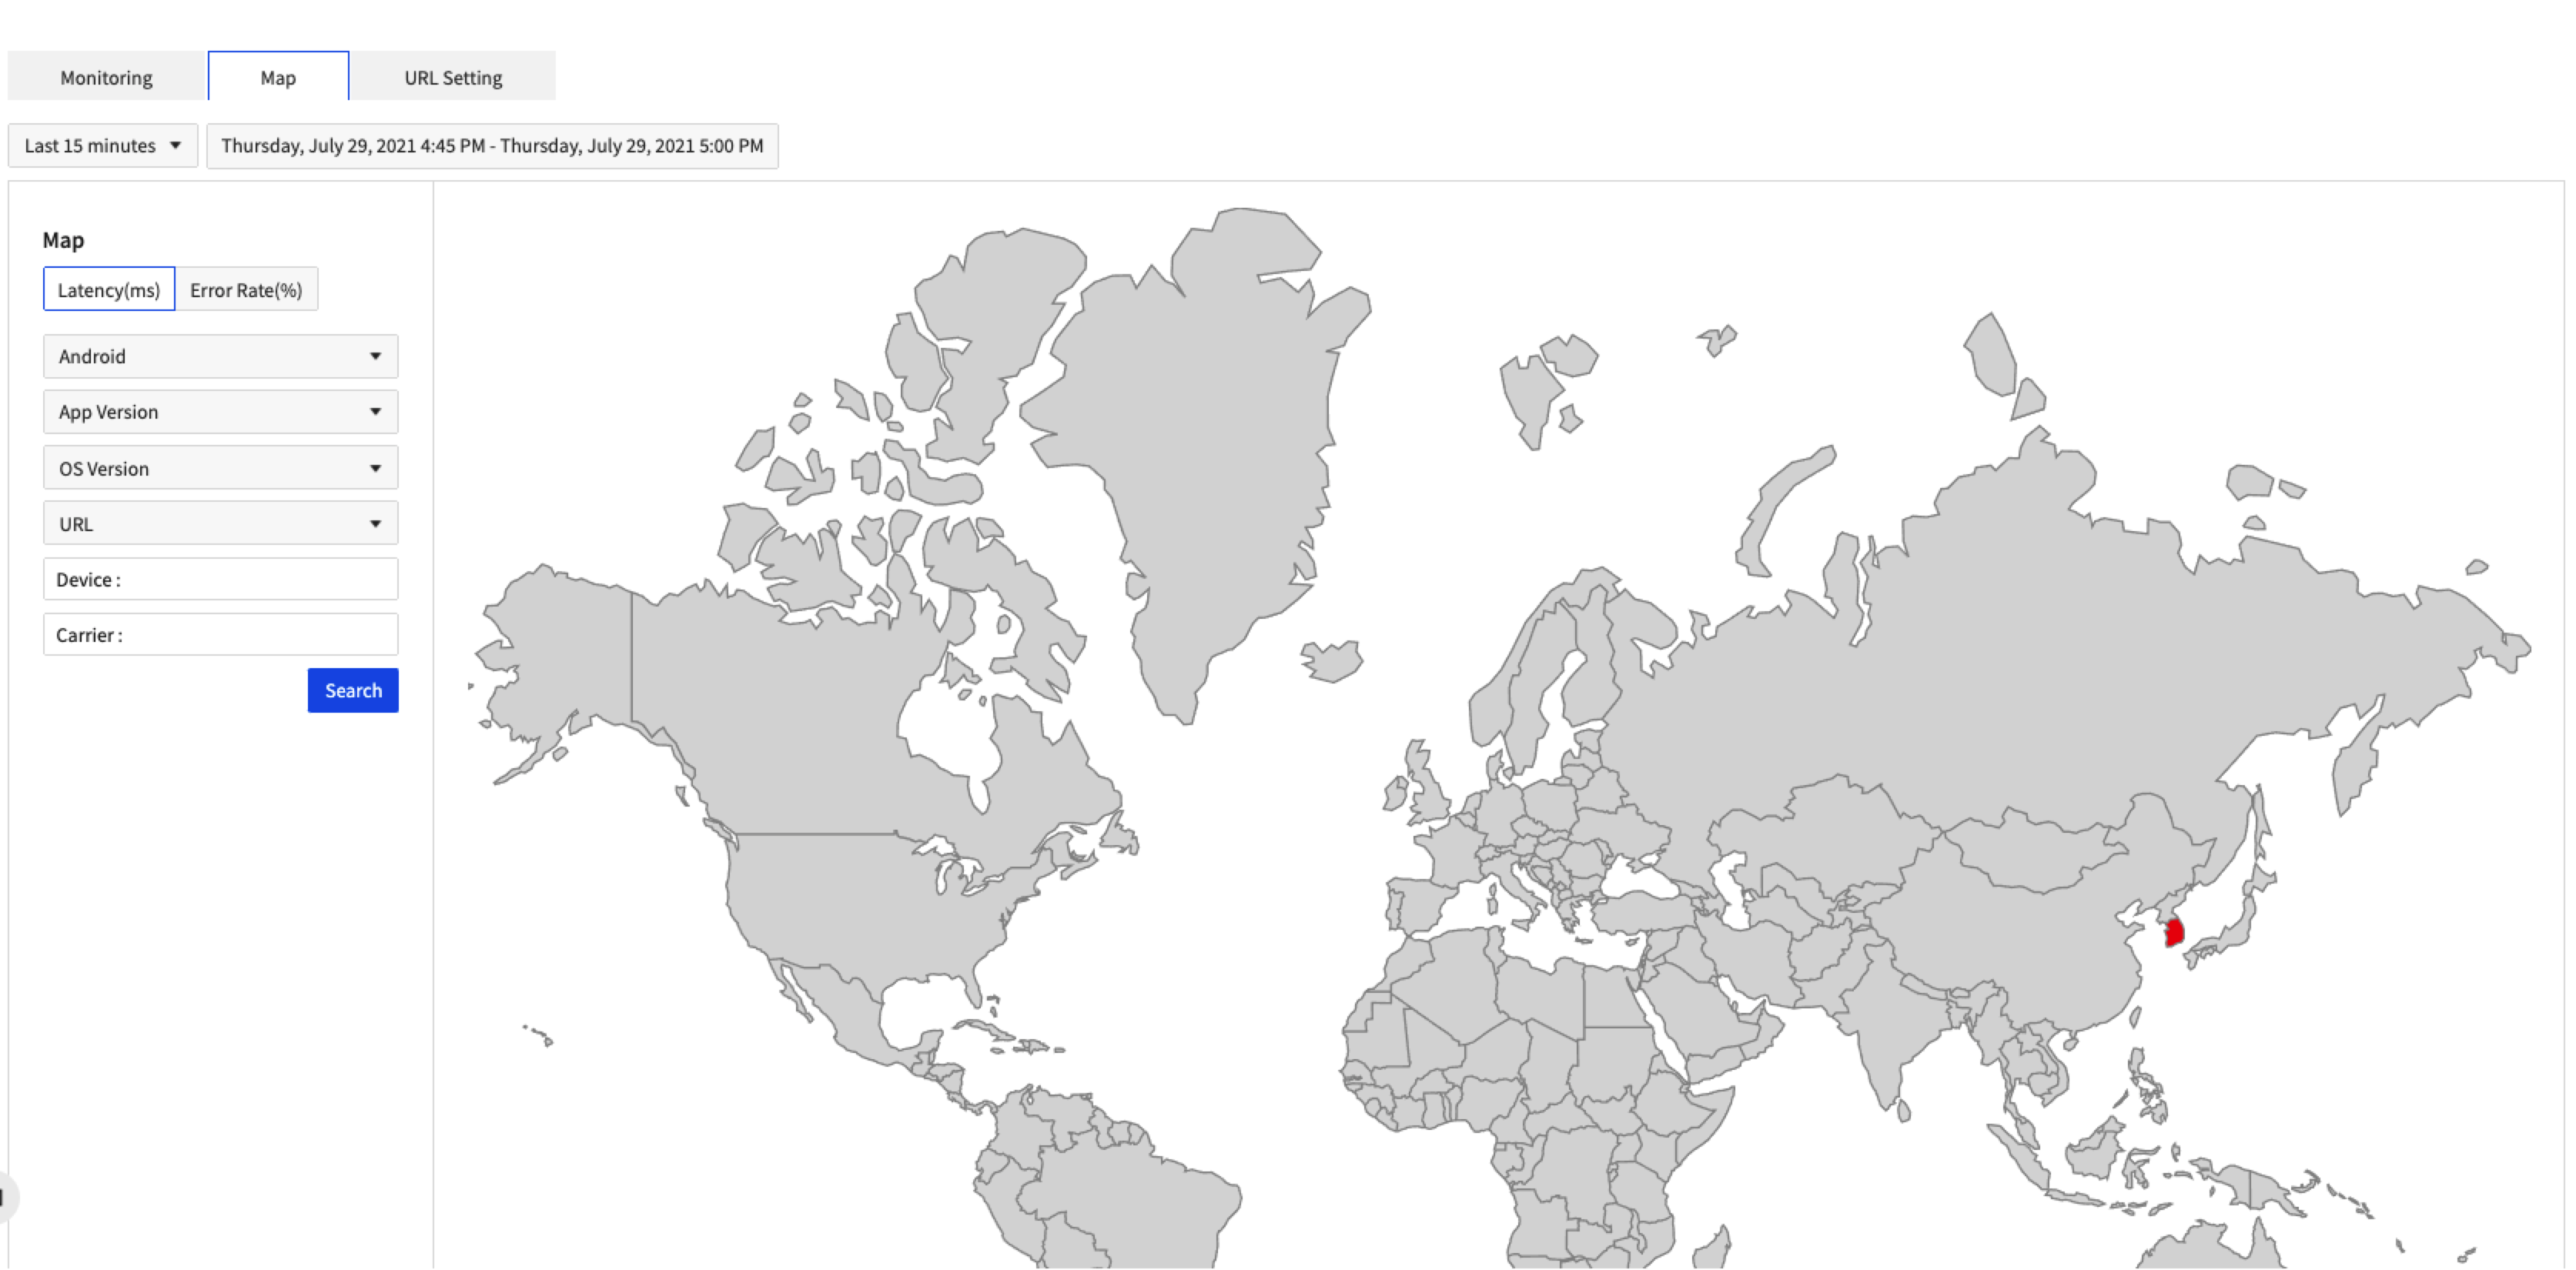
Map
- Display latency and error rate on a map.
| Item | Description |
|---|---|
| Map Types | There are two types of map: latency and error rate types. |
| Filter Conditions | - Recent: Retrieving filter of each time, such as recent 15 minutes, 60 minutes, 24 hours, or 48 hours. For user-defined conditions, retrieve by selecting start/end dates (up to 48 hours). - App Version: Retrieving filter per app version - OS Version: Retrieving filter per OS version - Device: Enter device name |
| Map | Latency and error rate is shown on the map. You can select iOS, Android, Windows, or WebGL from Current Platform dropdown menu. |
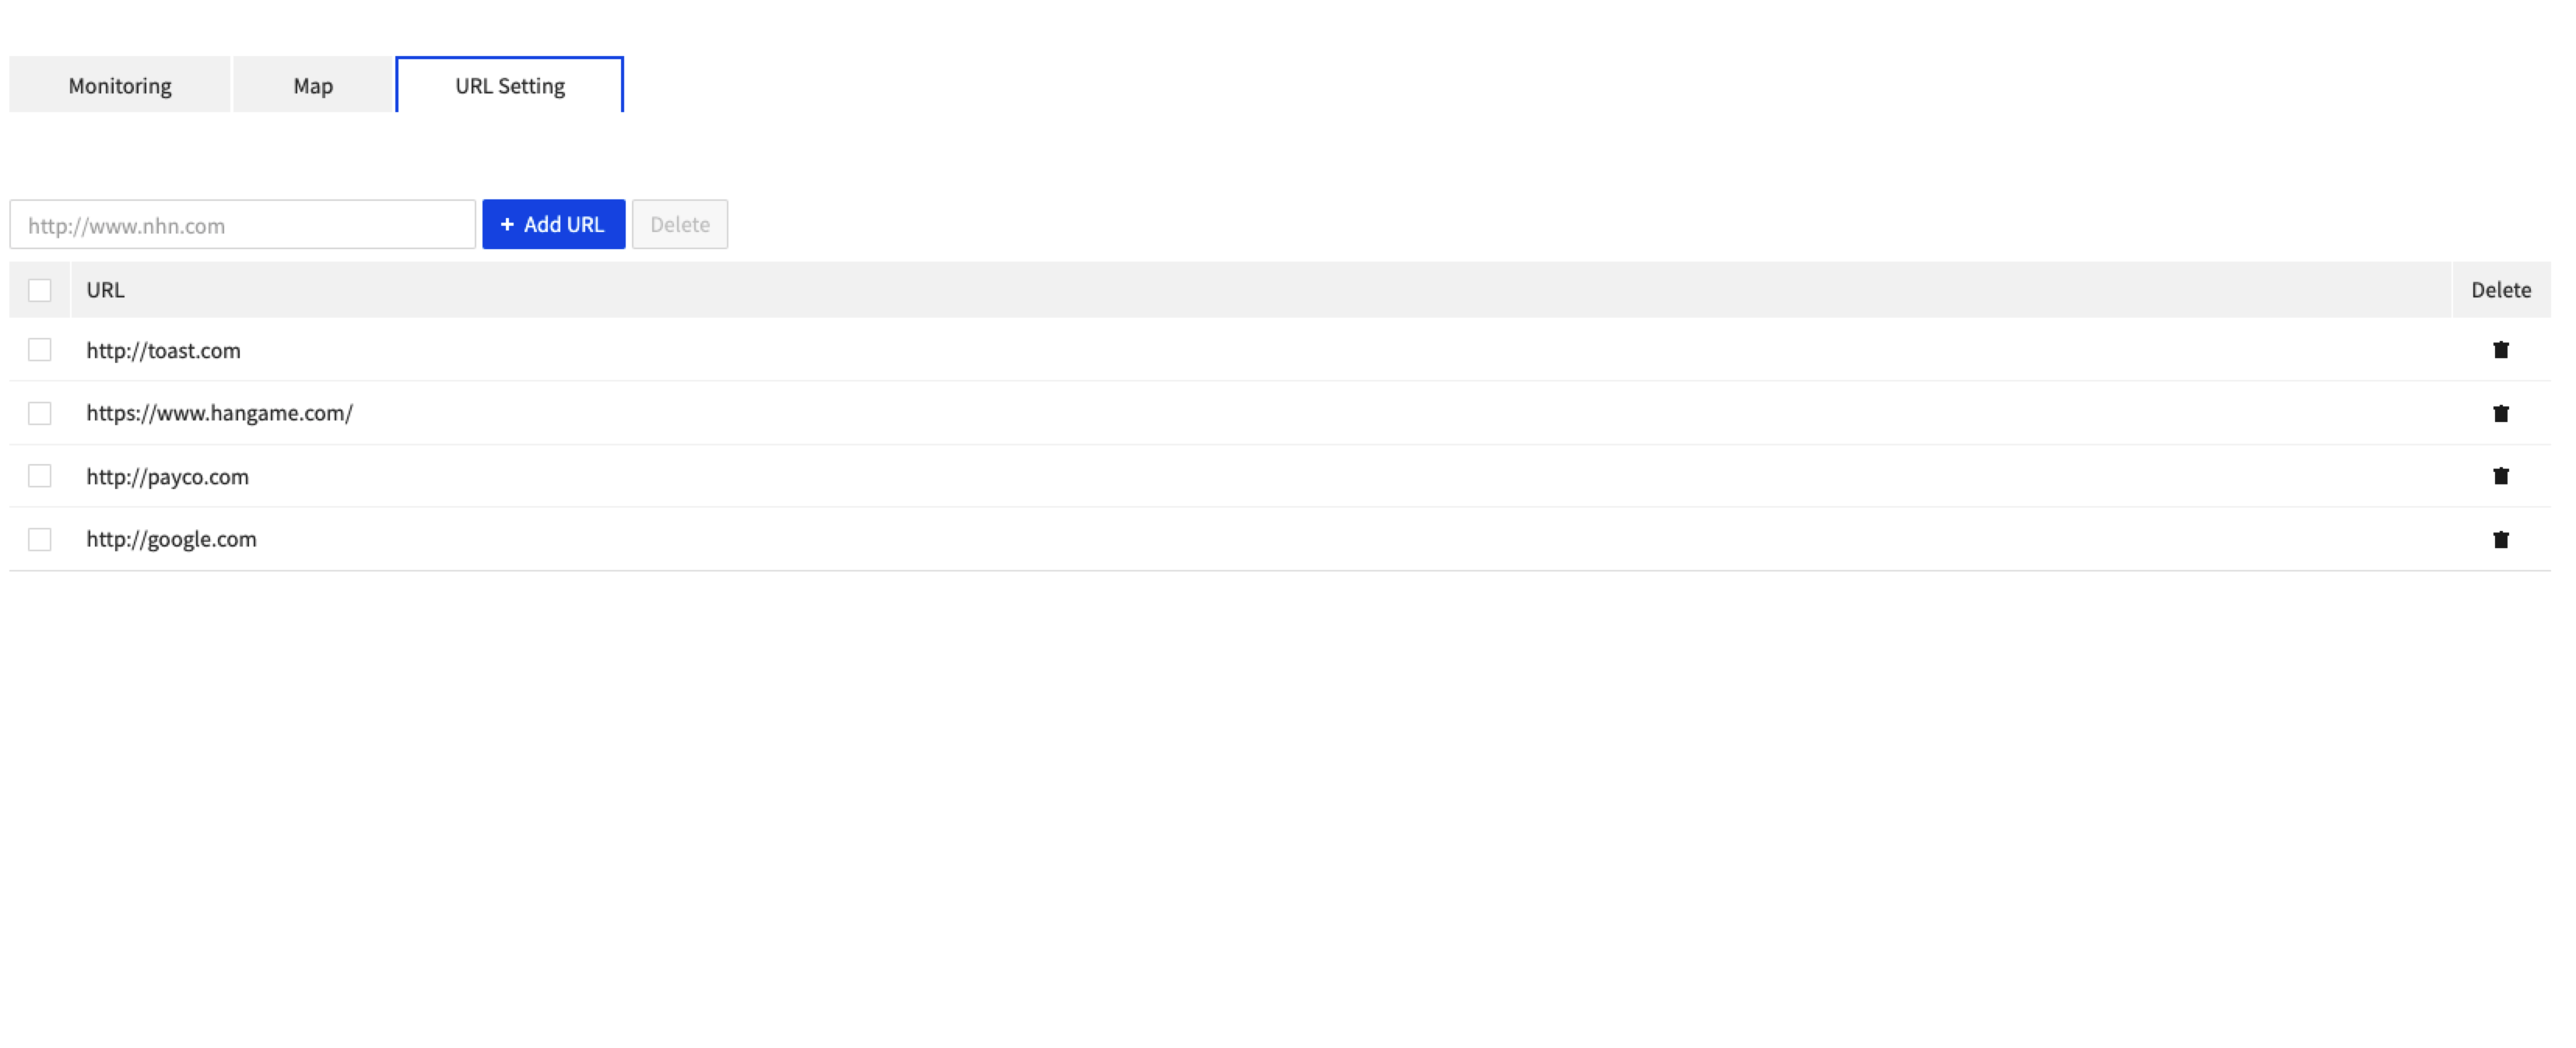
URL Setting
- Add or remove URLs for latency and error rate monitoring.
| Item | Description |
|---|---|
| URL Table | Shows the list of URLs for latency and error rate monitoring. You can add an URL from the top-right corner. To remove from the list, check the checkbox and click [Delete Selected Items]. |
Table of Contents
- Data & Analytics > Log & Crash Search > Console User Guide
- Select a Project
- Enable the Service
- Check Appkey
- Send Logs
- Search Logs
- Query App Crashes
- Query Issues
- Issue Trend
- Crash Report
- Query Issues by User
- Issue Statistics
- Alarm
- Log Alarm Setting
- Log Alarm History
- Crash Alarm Setting
- Crash Alarm History
- User-defined Alarm Setting
- User-defined Crash Alarm History
- Setting
- Search Field
- Issue Tracking
- Symbol File
- Log Retention Period
- Log Transfer Configuration
- External Log Storage Setting
- Network Insights
- Monitoring
- Map
- URL Setting