Game > GameAnvil > Console User Guide > Monitoring
Monitoring
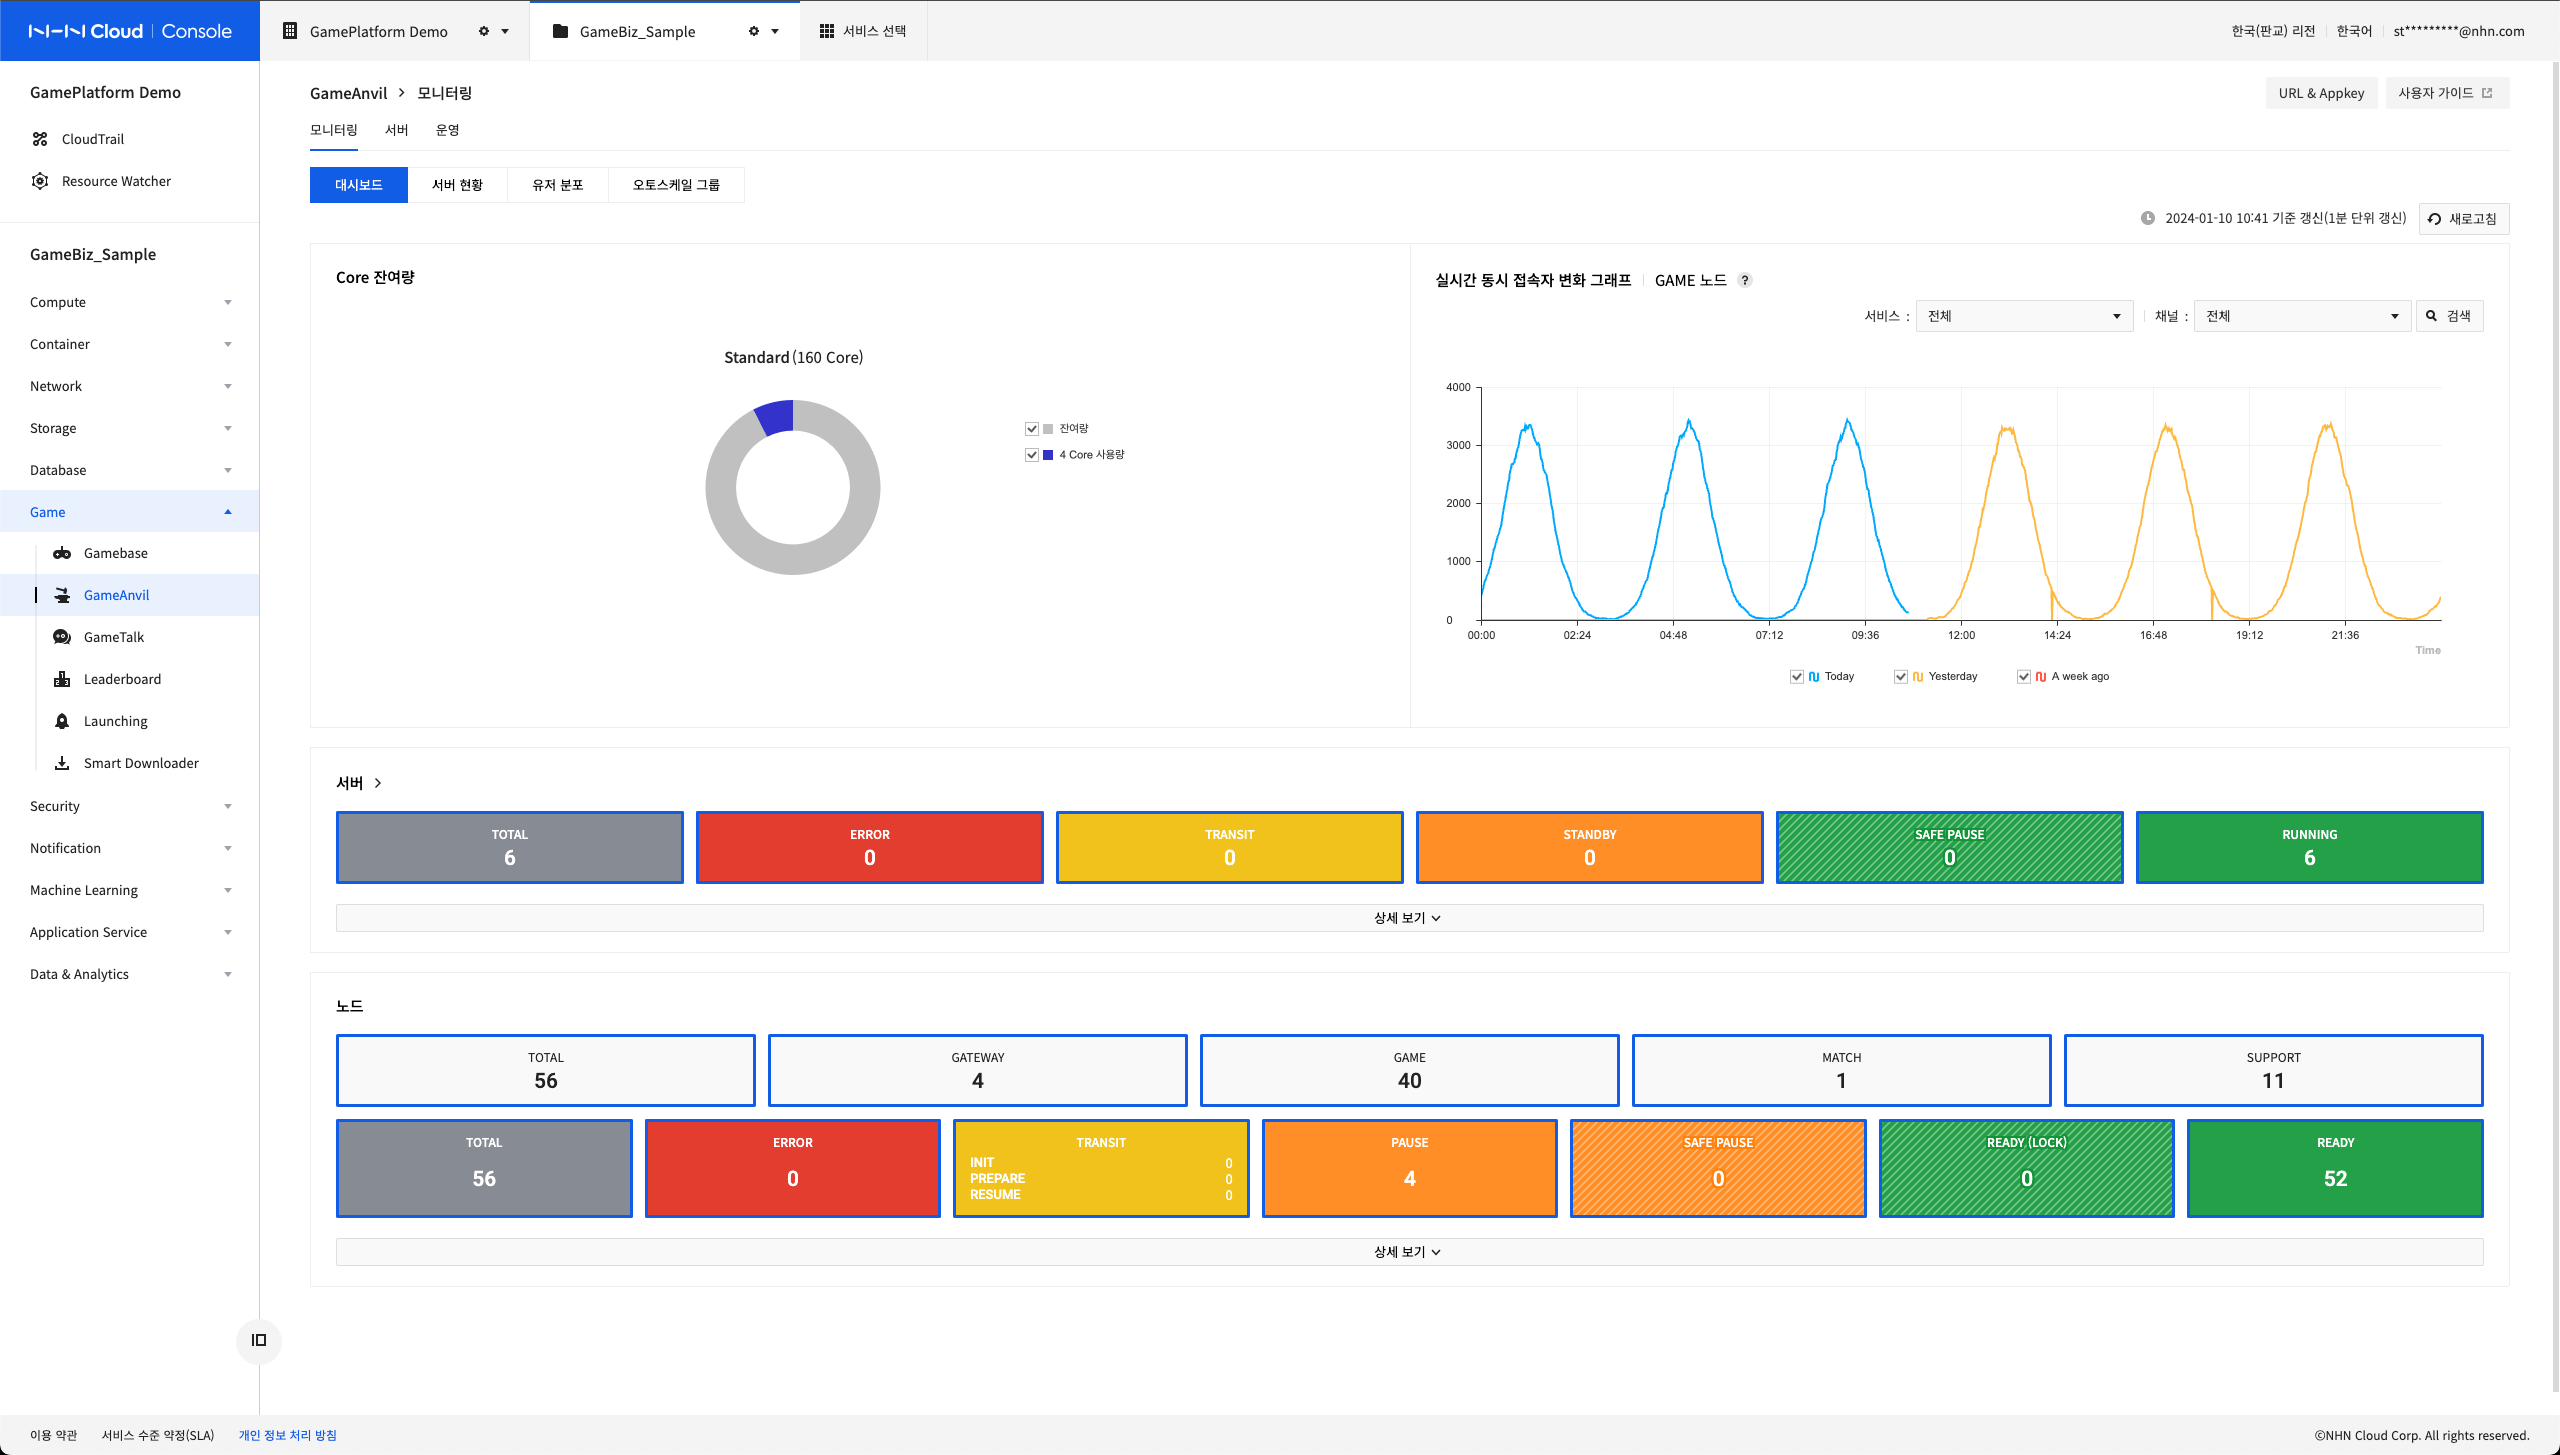
Dashboard tab of the Monitoring Menu provides significant statistics across the game server along with a graph. It shows the status of the server and node, as well as the count of users, rooms and sessions created in real time.
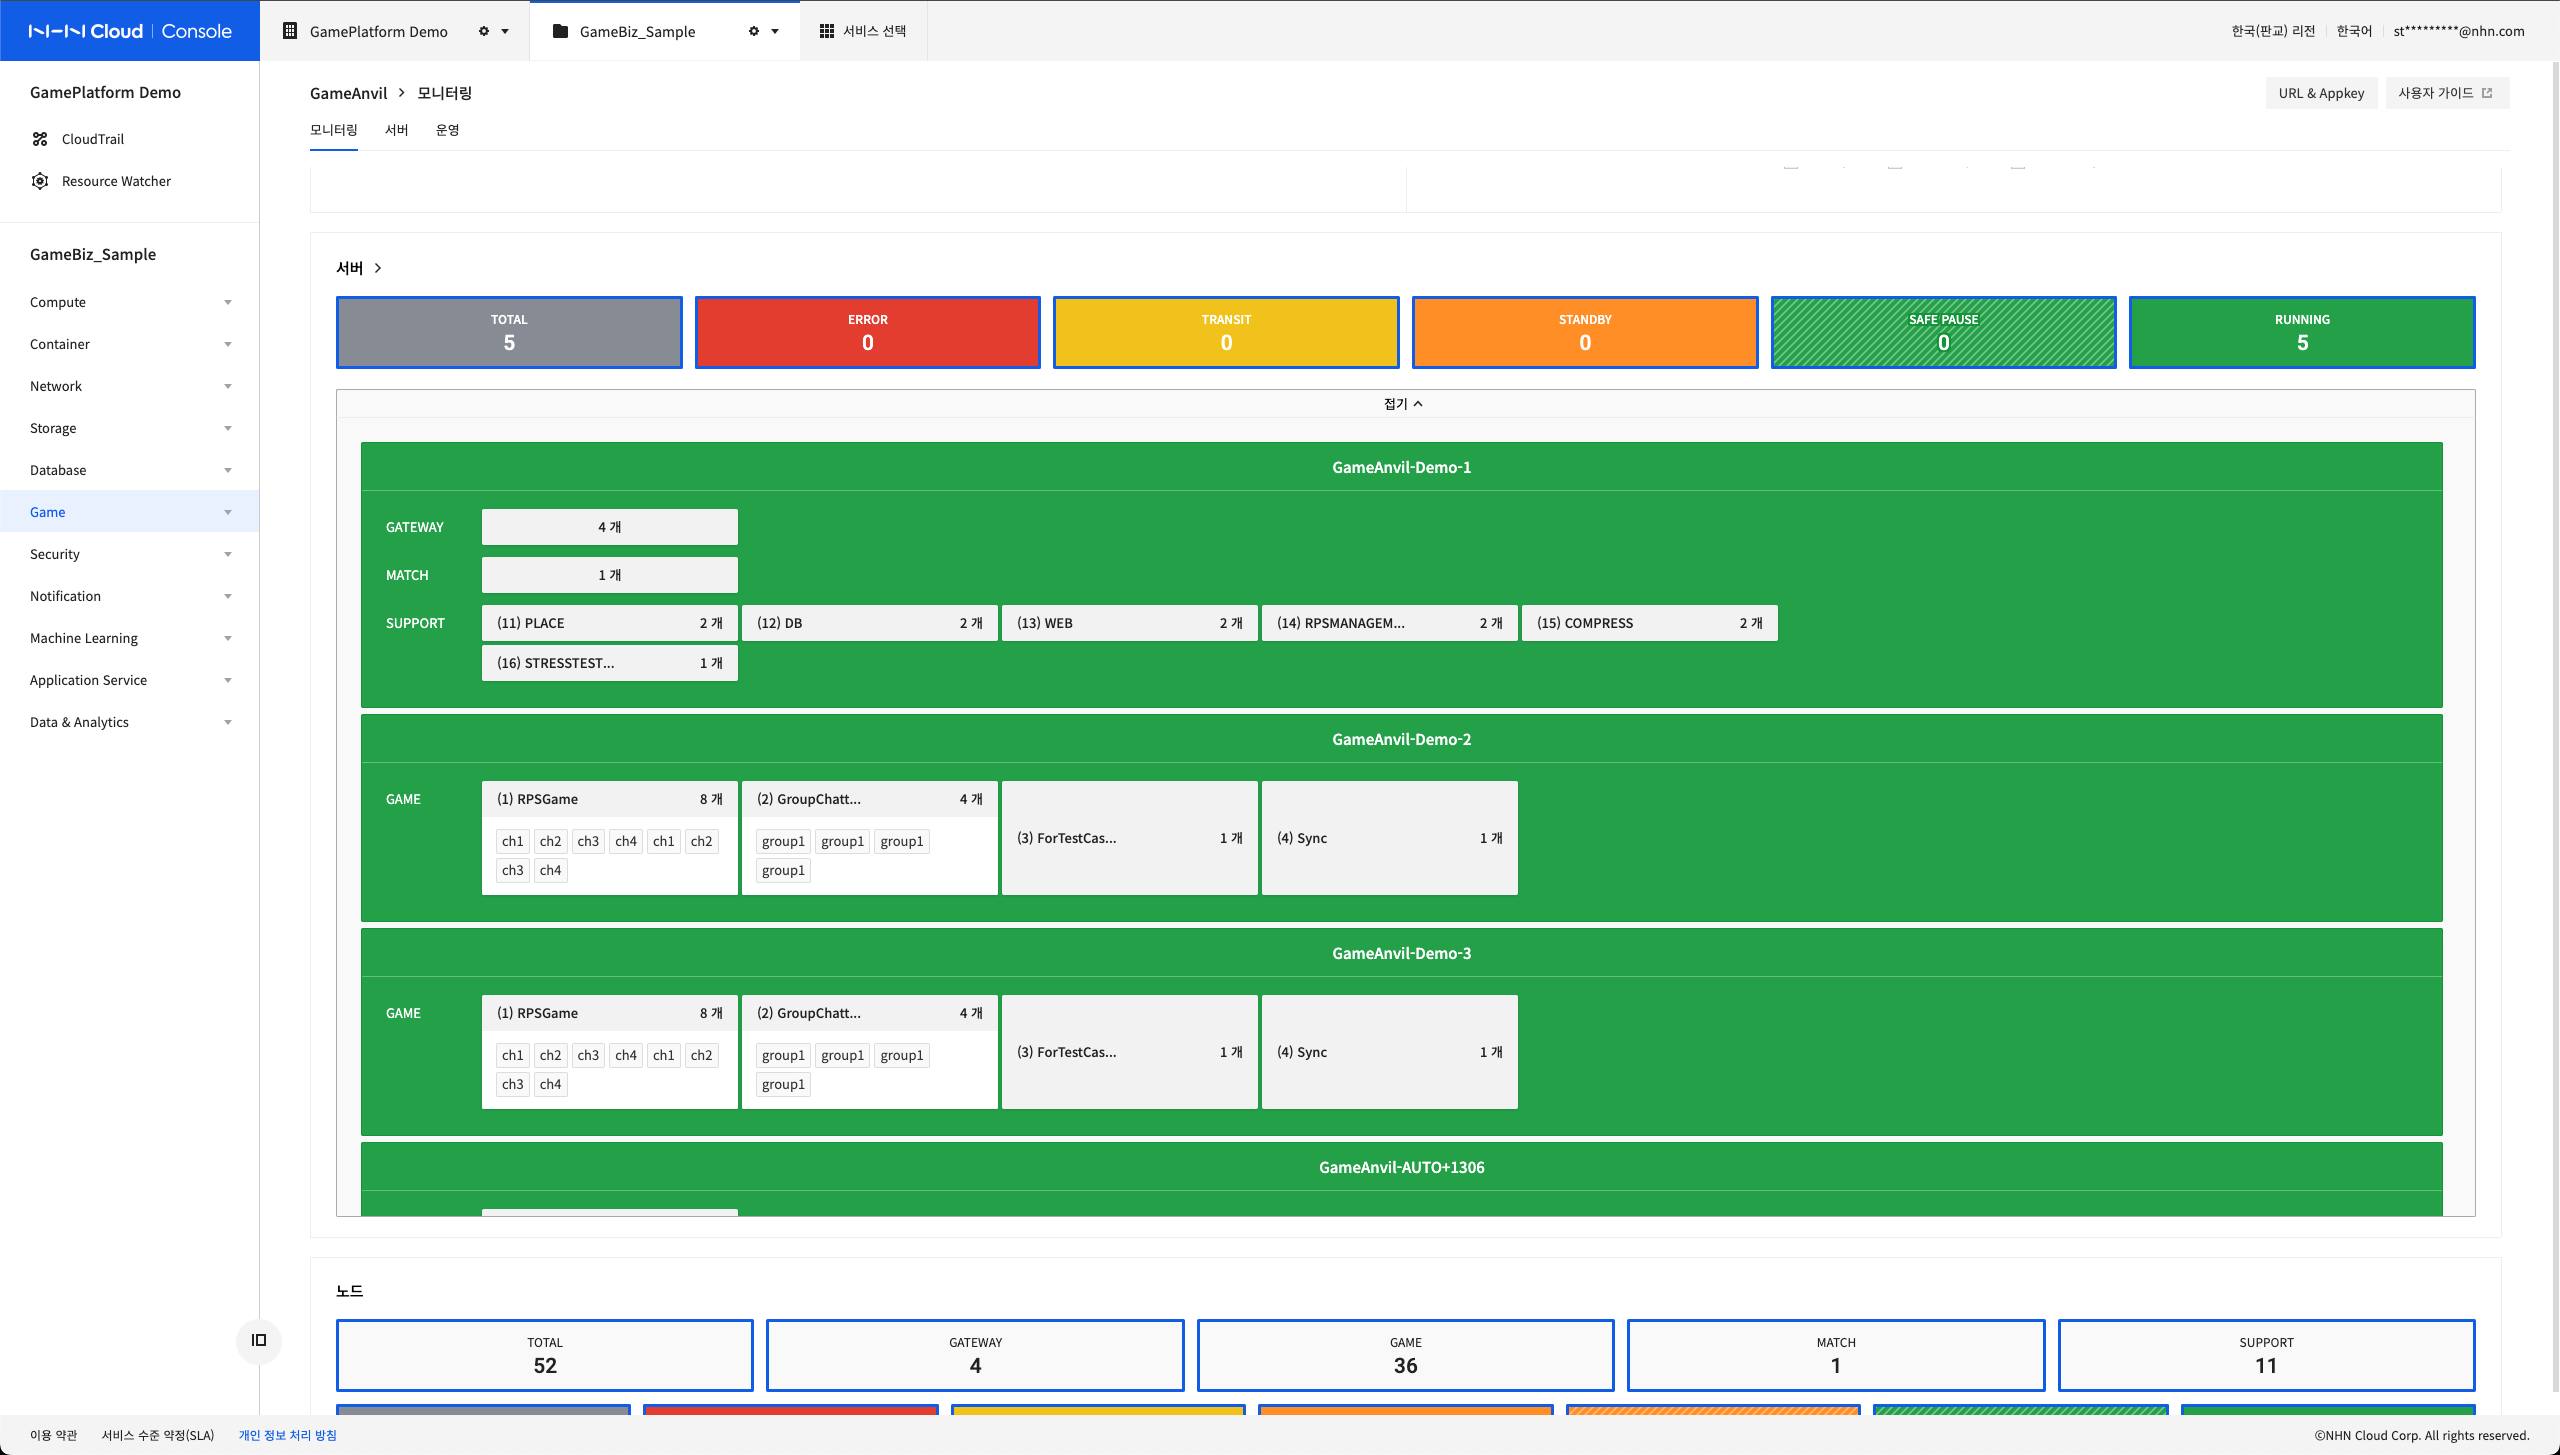
The server information and node information shown on the dashboard can be expanded in detail. The following shows the server information when viewed in detail.
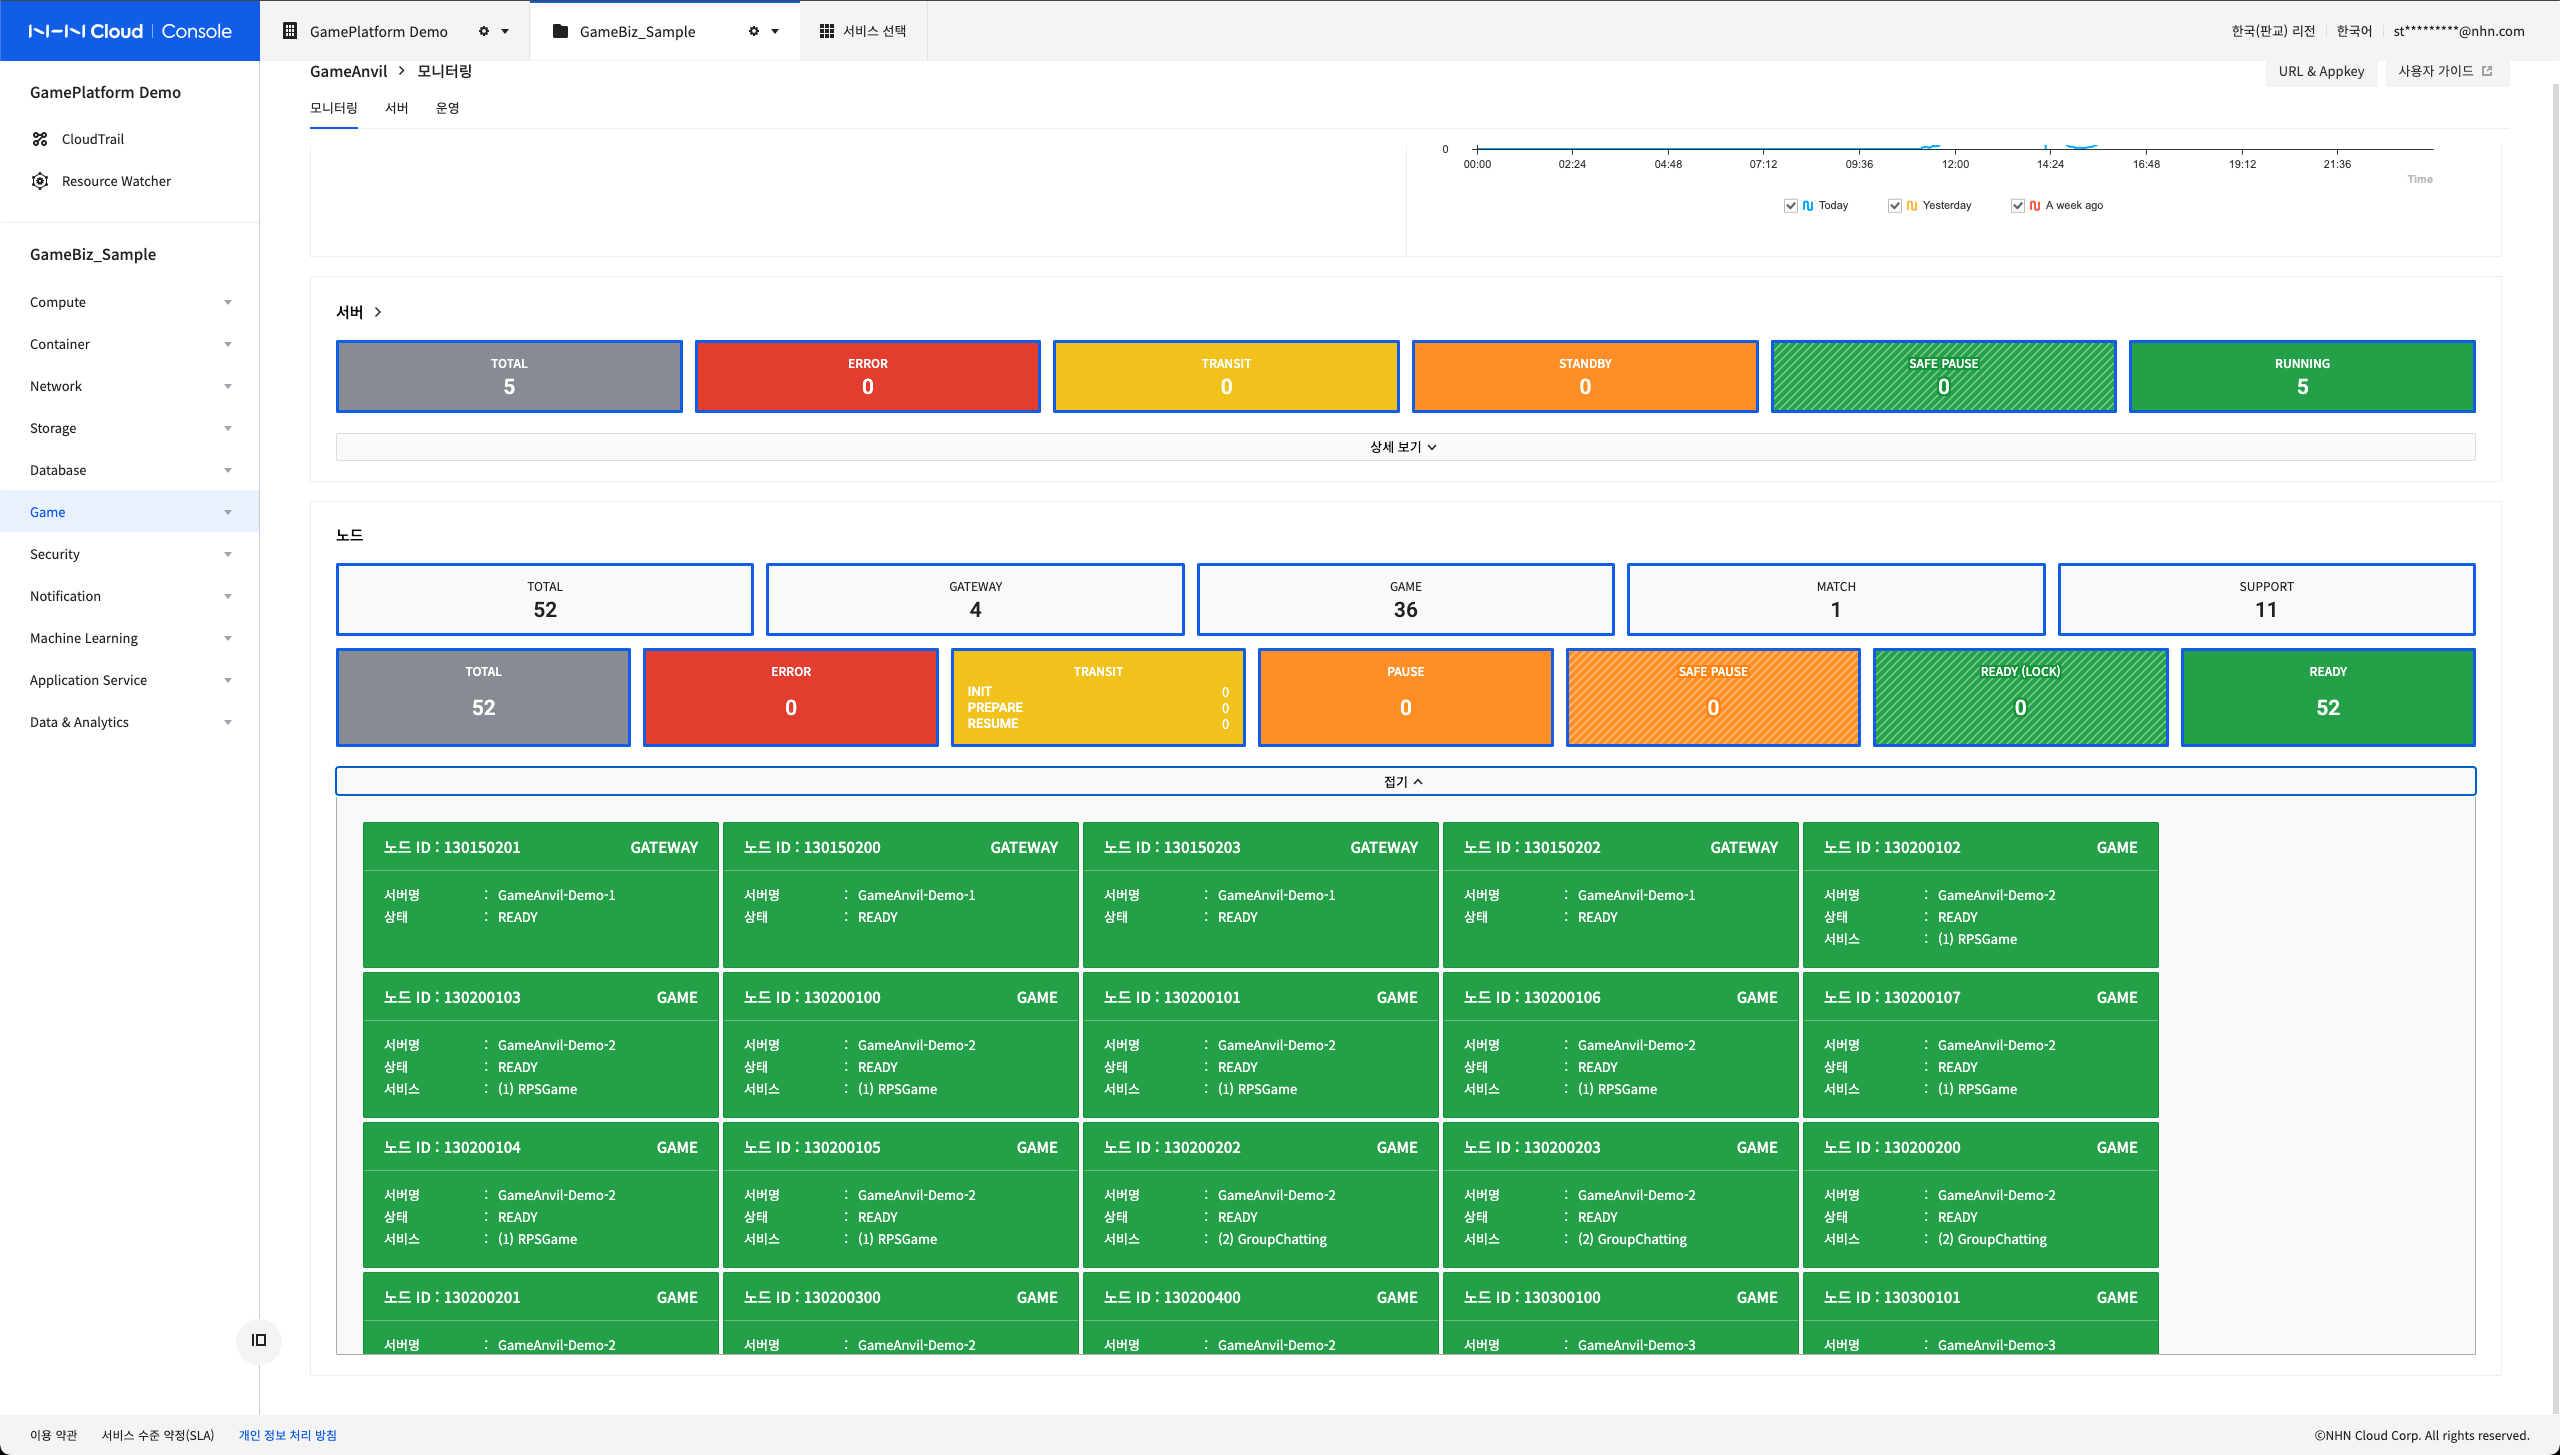
Similarly, the following is the node information when viewed in detail.
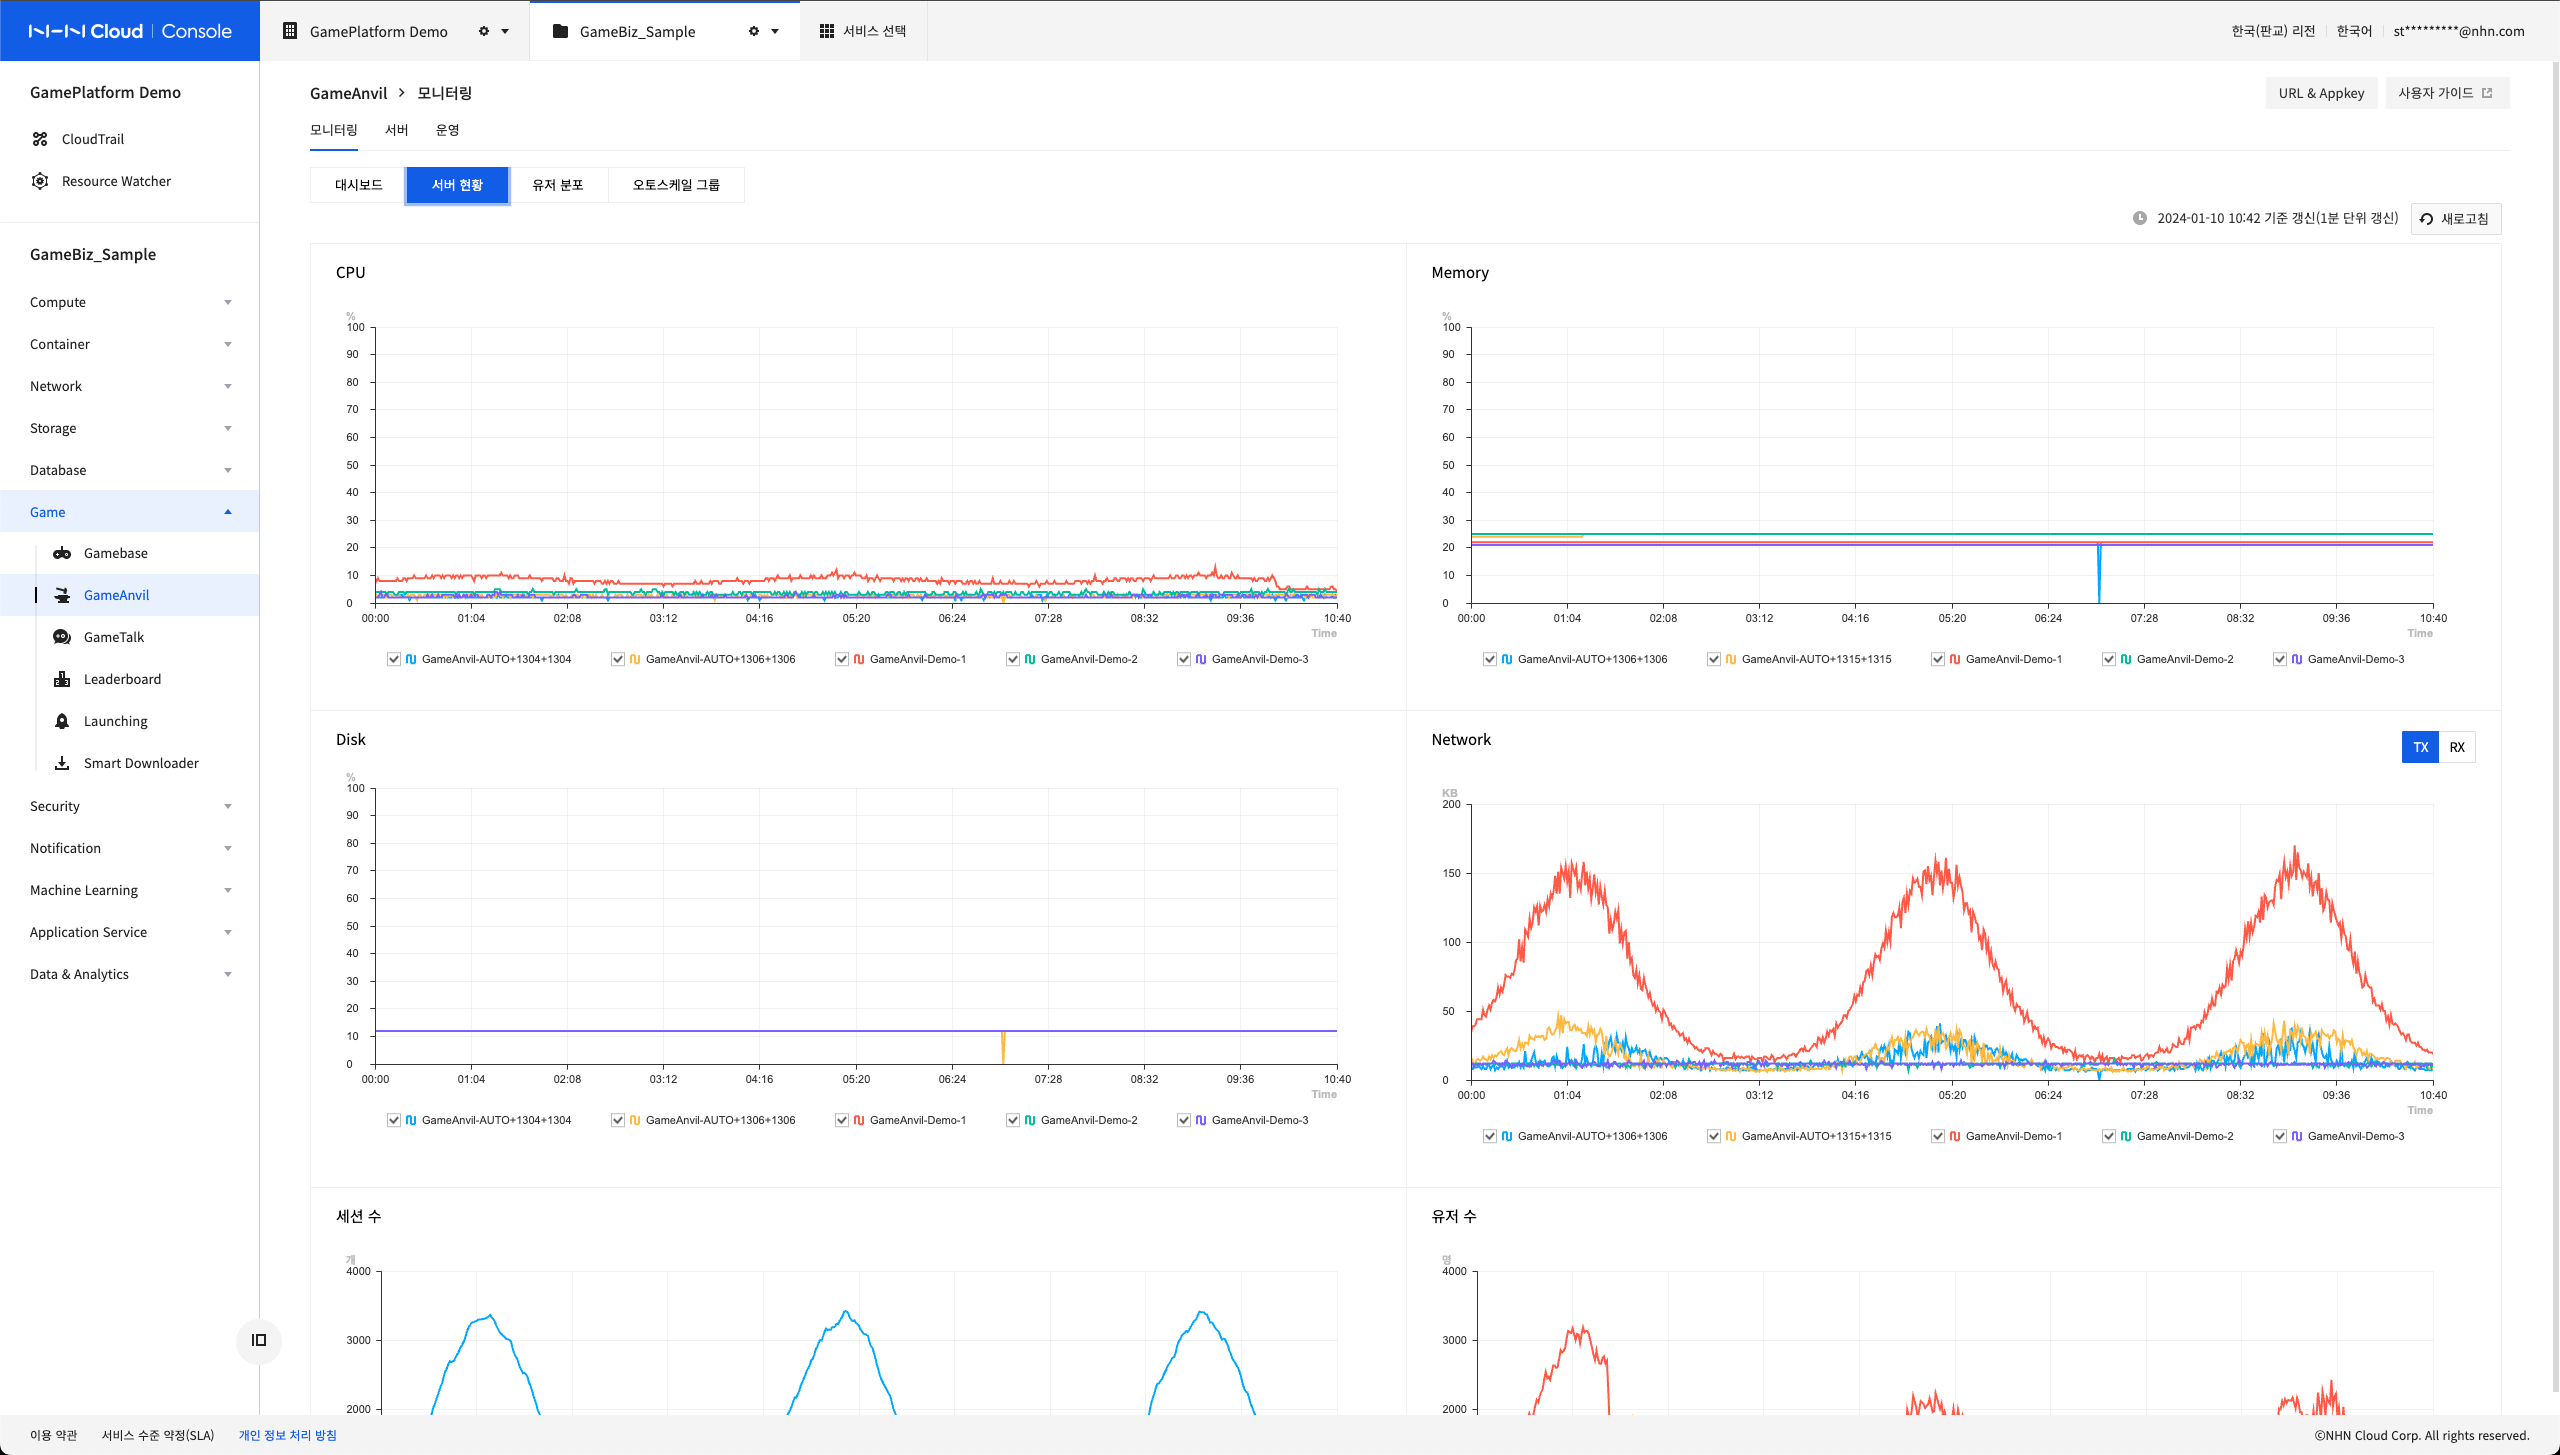
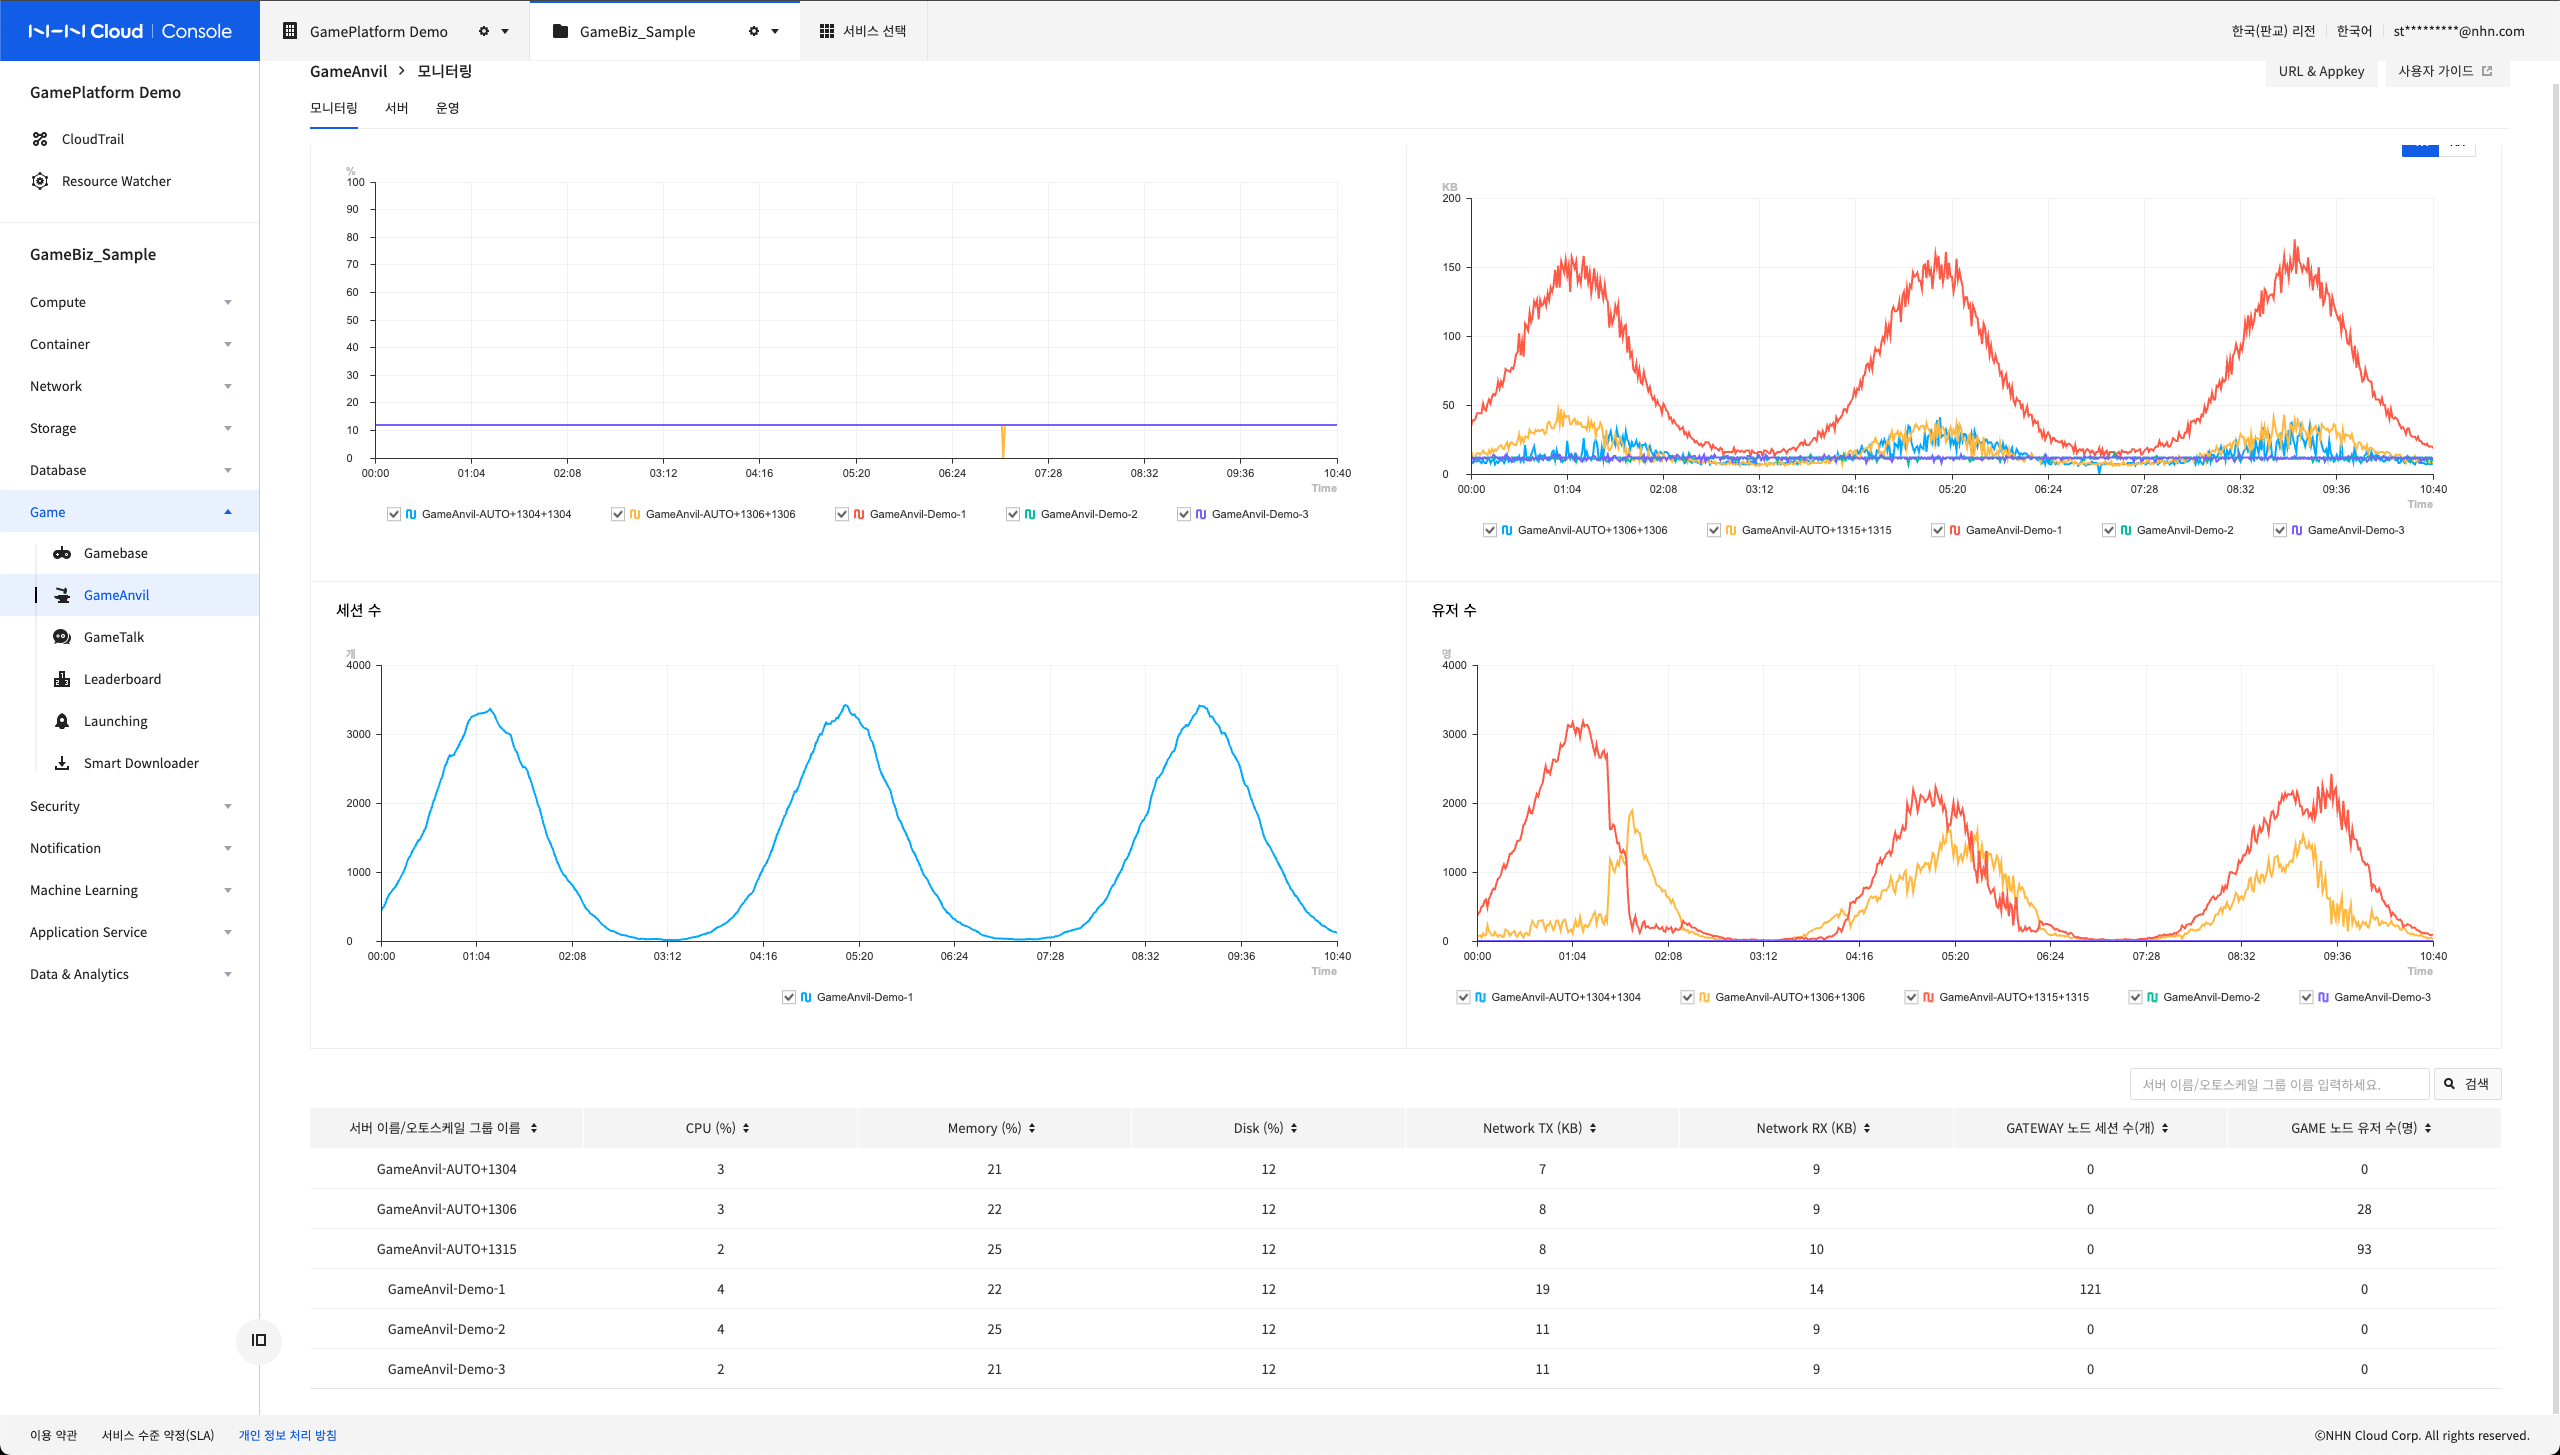
Server Status
The Server Status tab provides information on logical resources (such as count of users, sessions, etc.) as well as physical resources for all servers. Each piece of information can track changes over time with an intuitive chart.
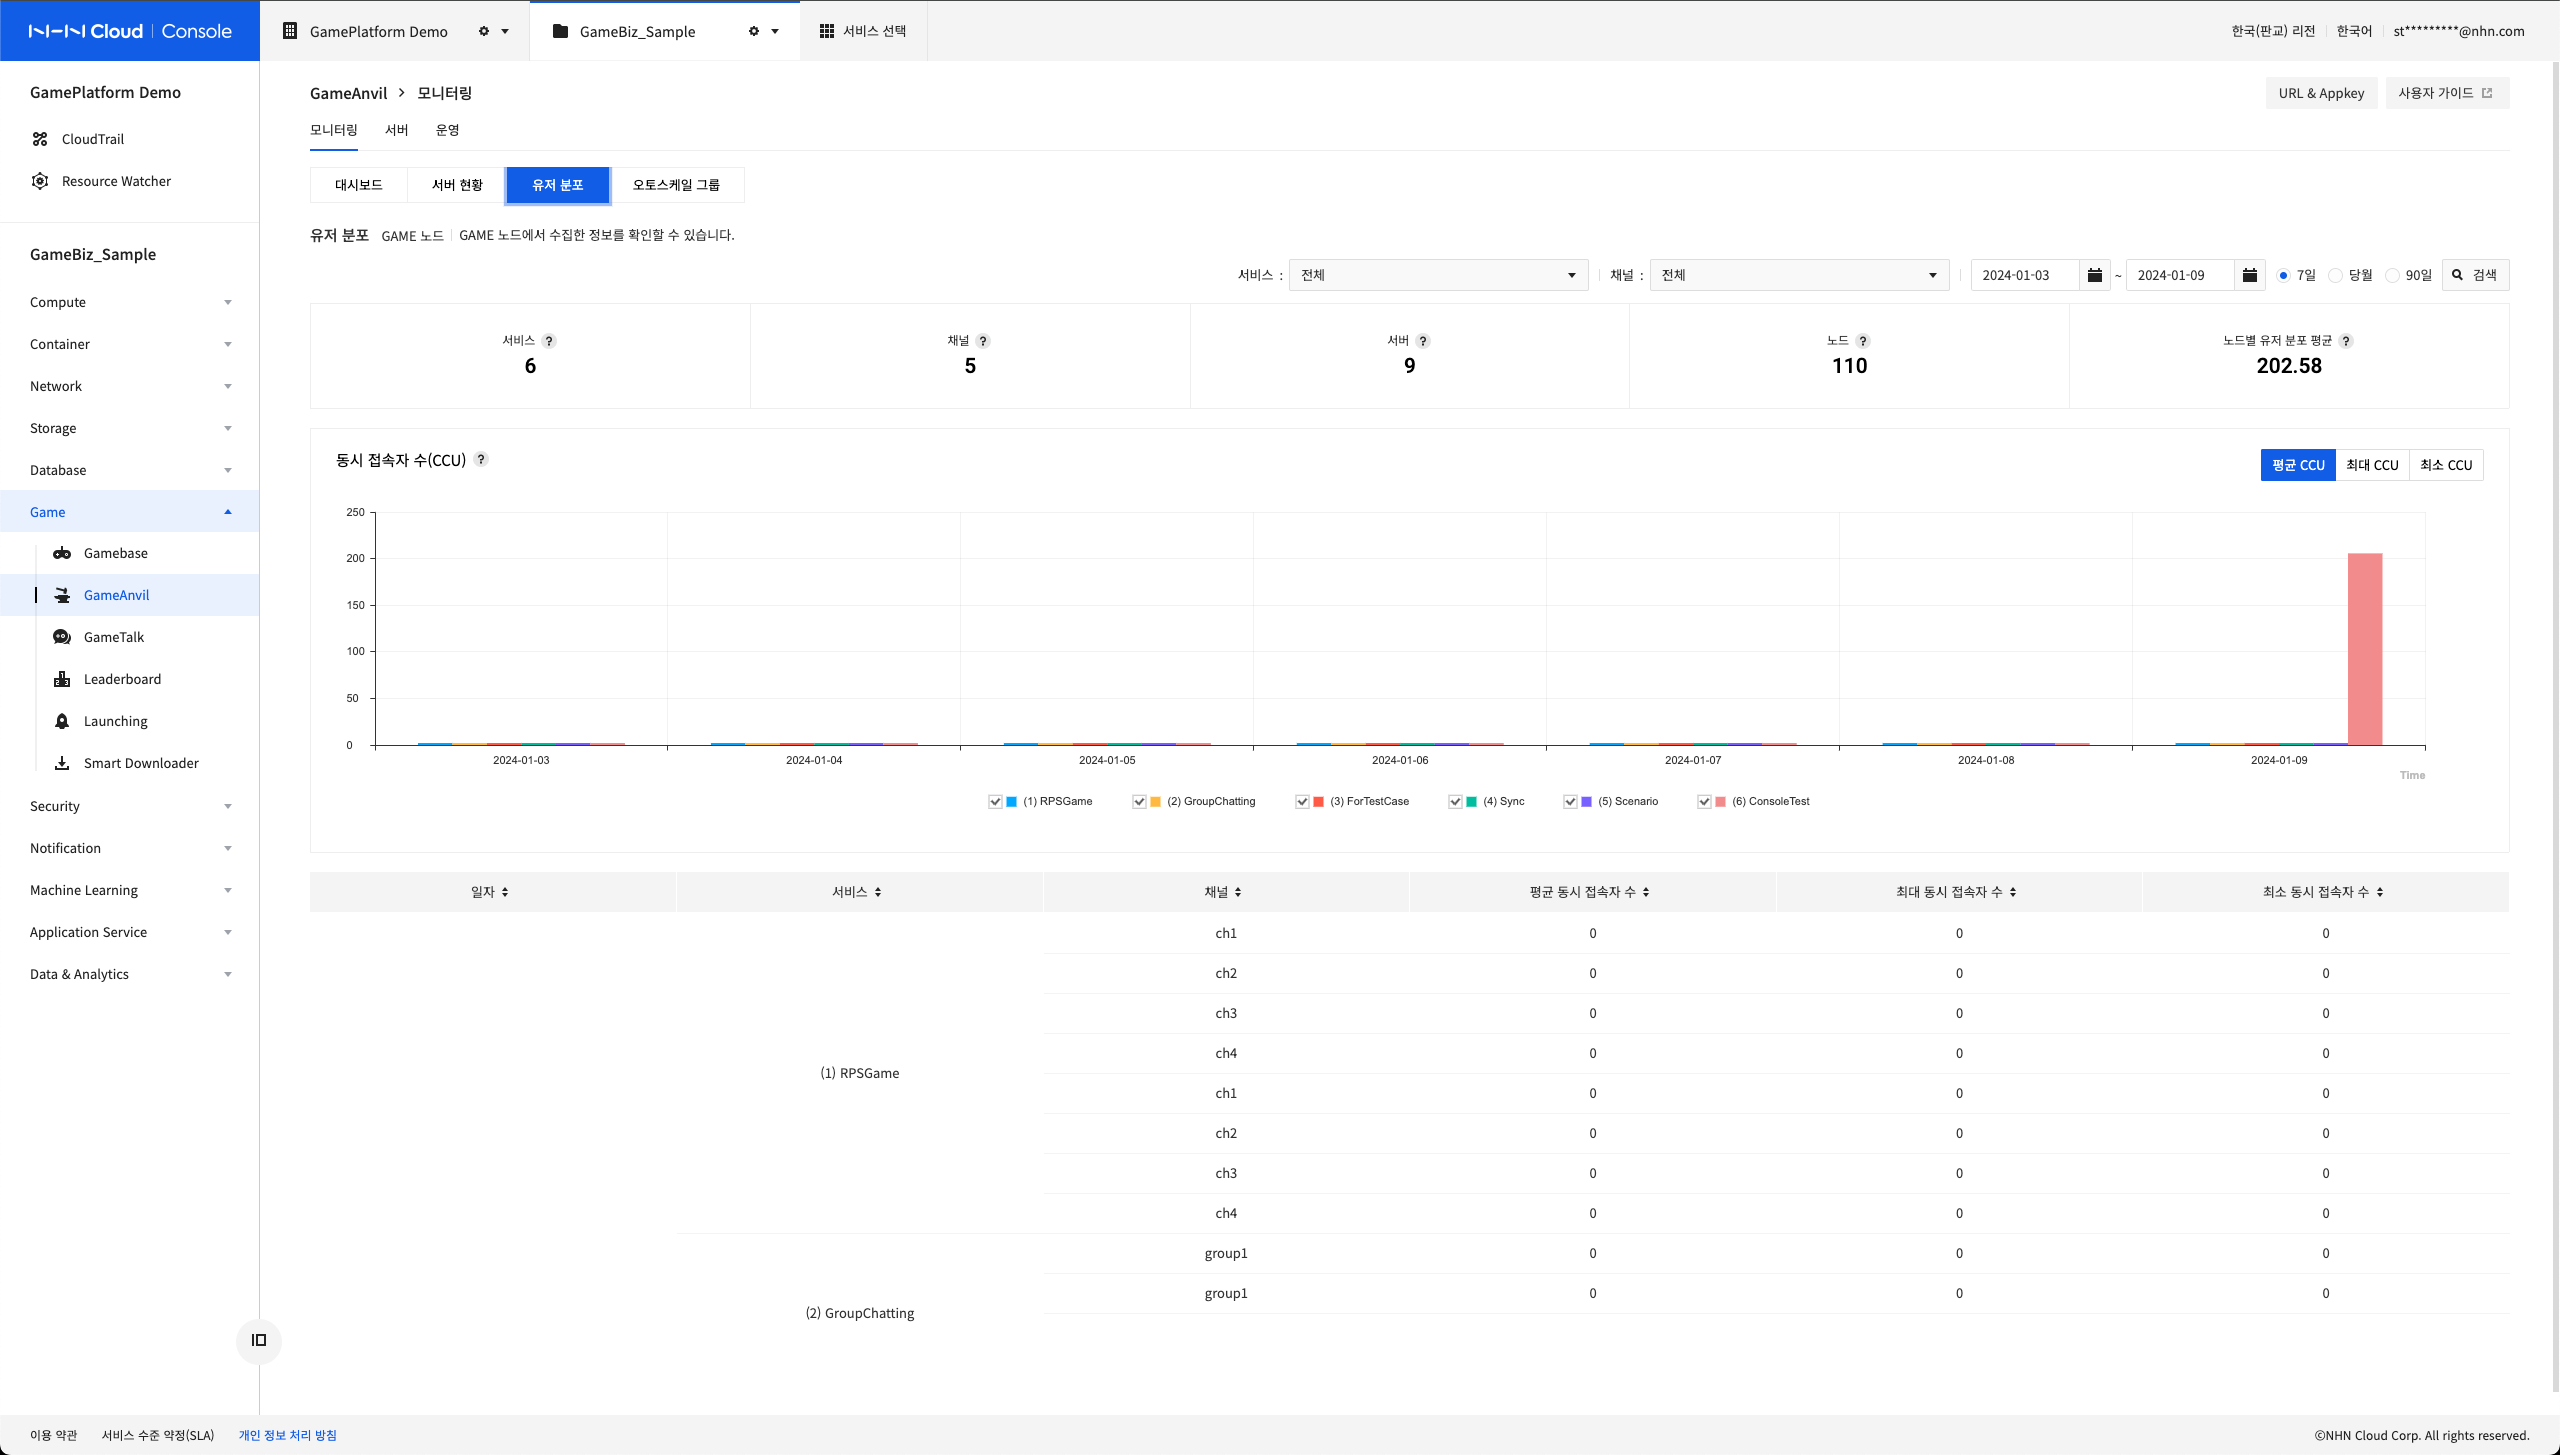
User Distribution
Concurrent user statistics are one of the most important pieces of information in the game service. The User Distribution tab provides a variety of information related to user distribution as well as CCU by date.
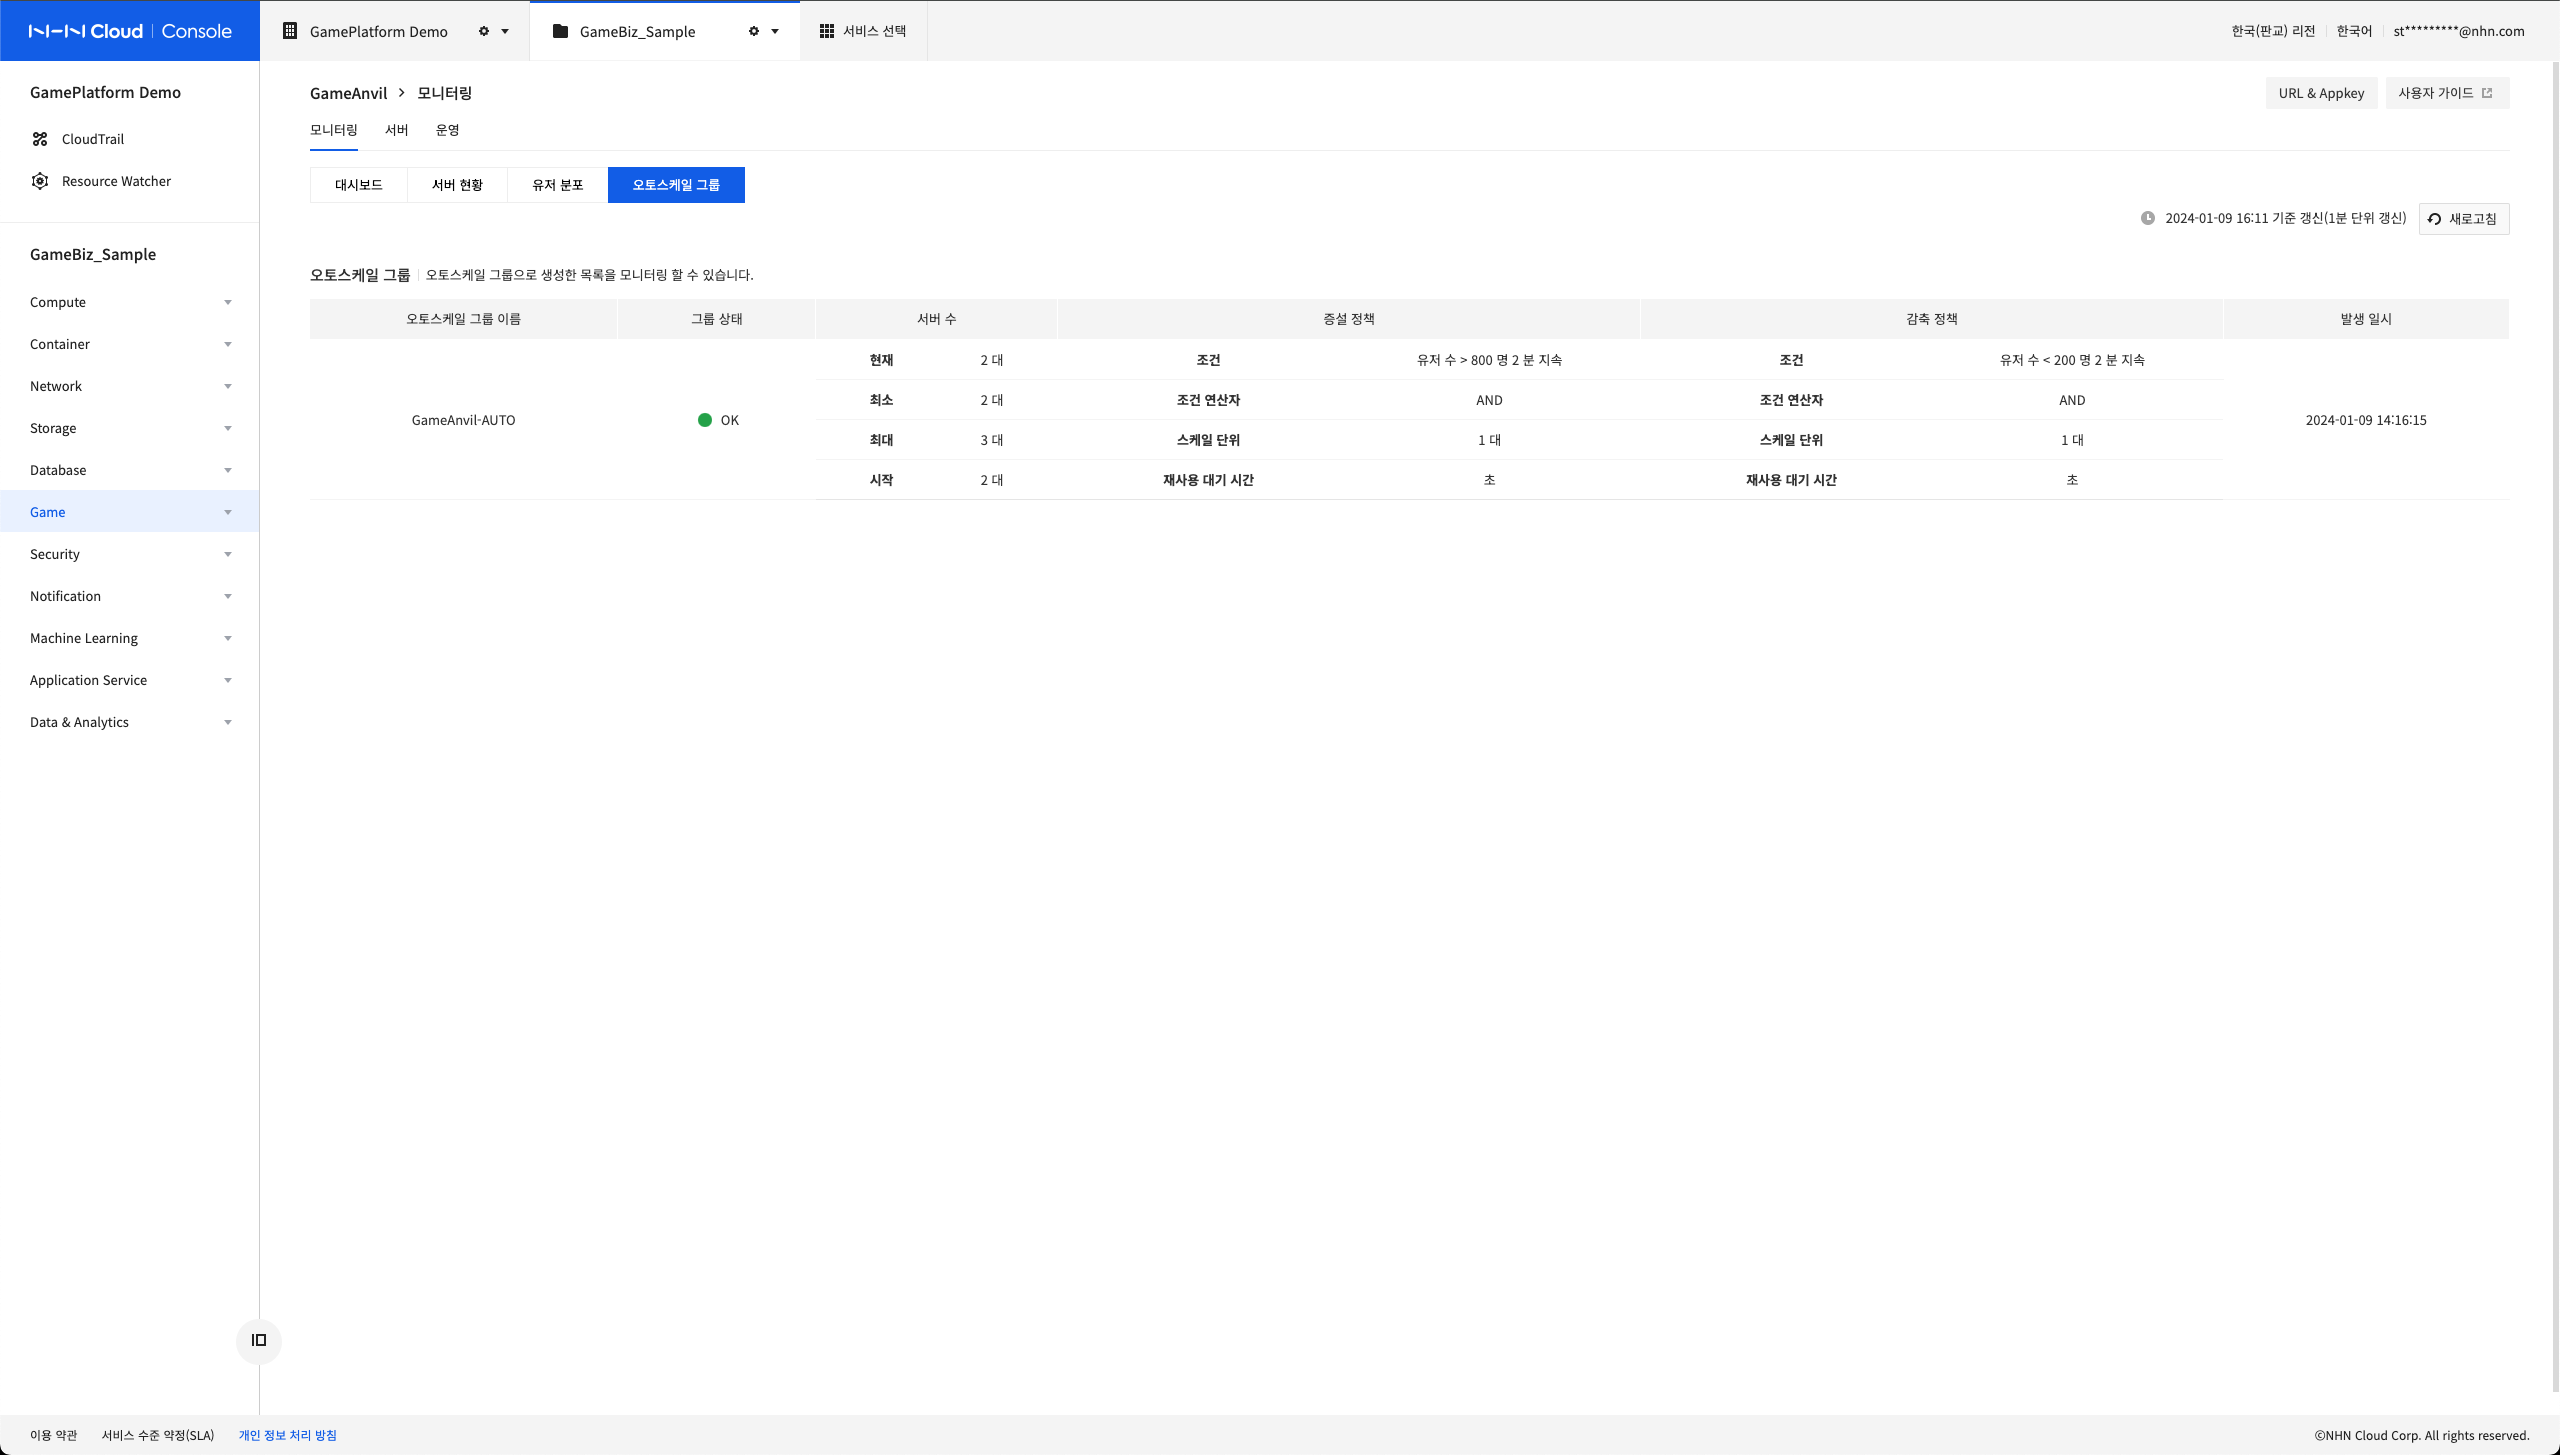
Autoscale Group
The Autoscale Group tab allows you view information about all autoscale groups that you have created.